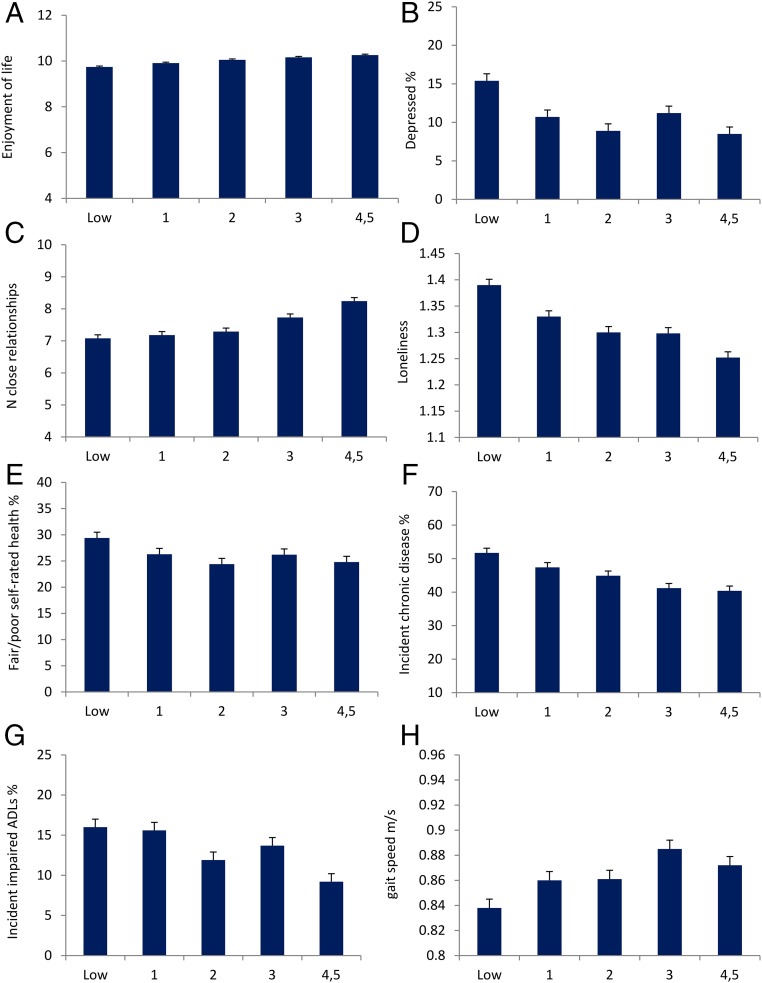
Fig. 3.
Longitudinal associations between life skills and psychological, social, health, and functional outcomes. The horizontal axis in each graph represents the number of life skills ranging from low to 4 or 5 recorded at baseline (2010). (A) Mean enjoyment of life scores in 2014 adjusted for enjoyment of life in 2010. (B) Proportion of individuals with depressive symptom scores ≥4 in 2014 adjusted for 2010 scores. (C) Mean number of close relationships in 2014 adjusted for close relationships in 2010. (D) Mean loneliness in 2014 adjusted for loneliness in 2010. (E) Proportion of respondents reporting fair or poor health adjusted for self-rated health in 2010. (F) Proportion of respondents with one or more incident serious chronic diseases between 2010 and 2014. (G) Proportion of respondents with incident impaired activities of daily living between 2010 and 2014. (H) Mean gait speed on the standardized walking test in 2014 adjusted for gait speed in 2010. All values were additionally adjusted for age, gender, parental occupation, educational attainment, and cognitive function. Error bars are SEM.

