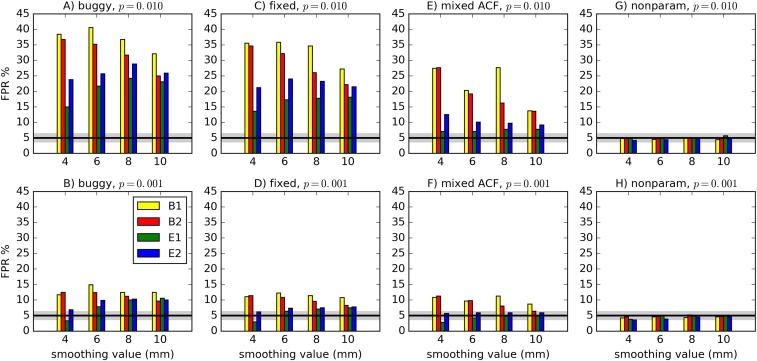
Fig. 1.
FPRs for various software scenarios, with 1,000 two-sample one-sided -tests (as in ref. 1; cf. ref. 3 for more details) using 20 subjects’ data in each sample. For “buggy” (A and B) and “fixed” (C and D), cluster-size thresholds were selected using the Gaussian shape model with the FWHM being the median of the 40 individual subjects’ values: “buggy” via 3dClustSim before the bug fix, “fixed” via 3dClustSim after the bug fix. For “mixed ACF” (E and F), the cluster-size threshold was selected using a non-Gaussian ACF model allowing for heavy tails (3). For “nonparam” (G and H), 3dttest++ was used to perform spatial model-free, nonparametric permutation testing (3); paired, two-sided, and tests with covariates gave similar results. Two different per-voxel P-value thresholds are shown. The black line shows the nominal 5% FPR (out of 1,000 trials), and the gray band shows its binomial 95% confidence interval, 3.65–6.35%. As in ref. 1, different smoothing values were tested (4–10 mm), and four test designs were used: B1 = 10-s block; B2 = 30-s block; E1 = regular event-related; E2 = randomized event-related.

