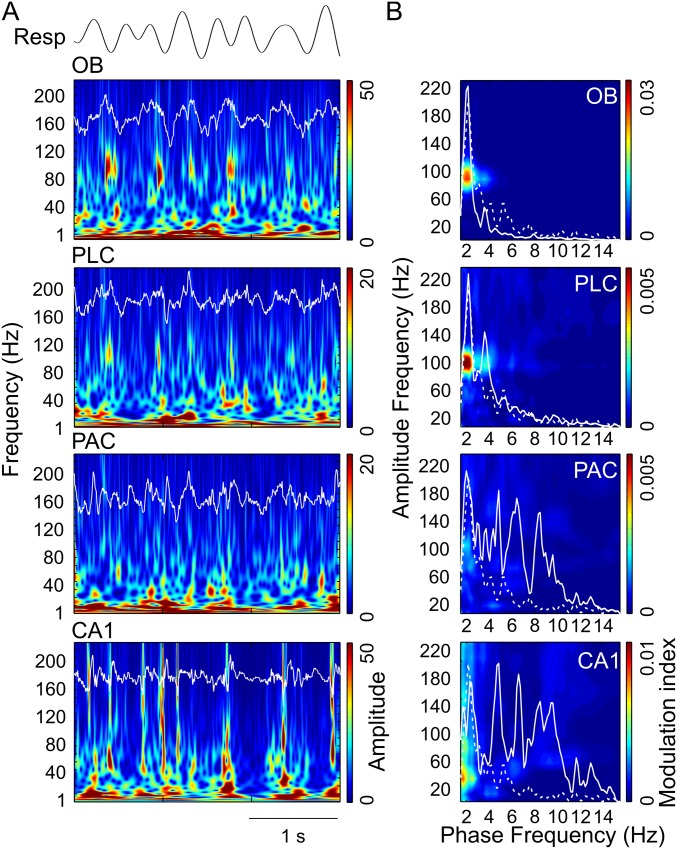
Fig. S1.
Region-specific and slow oscillation-specific coupling of different gamma subbands during NREM sleep. (A) Wavelet spectrograms and superimposed LFP signals (white traces) from OB, PLC, PAC, and CA1 simultaneously recorded during NREM sleep. The top trace shows nasal respiration (Resp) signal. (B) Cross-frequency comodulograms along with power spectra of LFPs (continuous white line) and Resp (dashed white line; same for all regions) computed during NREM sleep. Notice in the comodulograms specific coupling of γ2 (80–120 Hz) to the RR in OB and PLC and the absence of coupling in PAC and CA1. All plots were obtained from the same epoch (group data are shown in Figs. S7 and S8).

