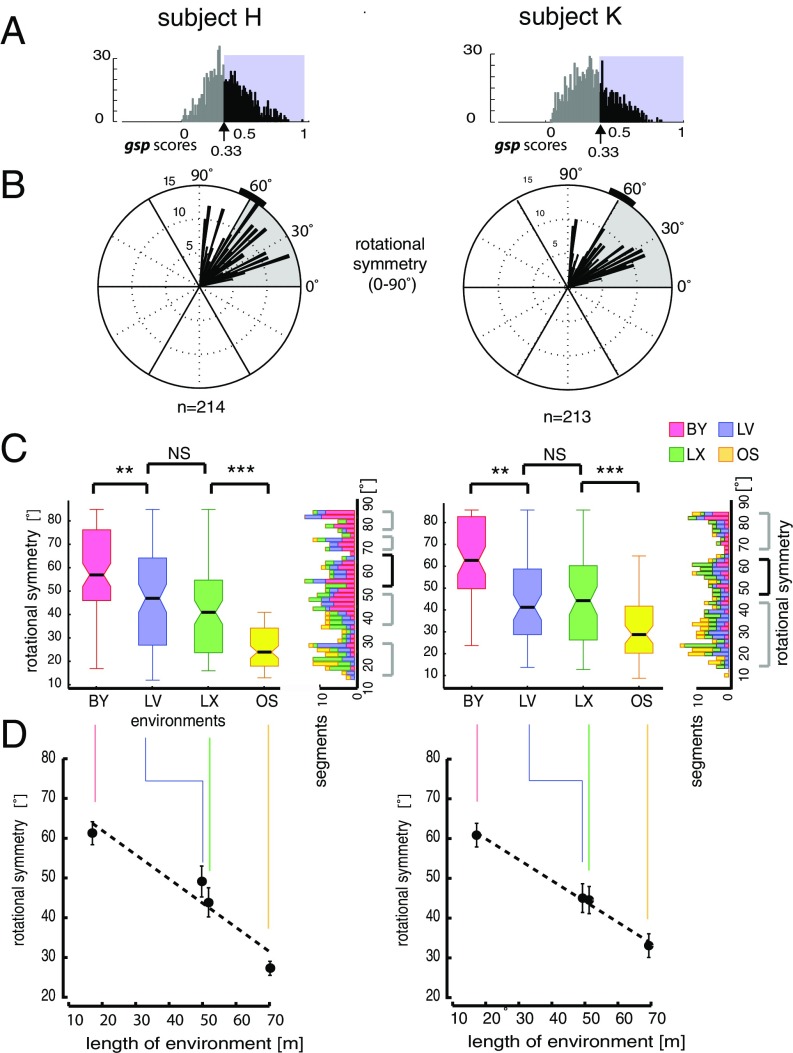
Fig. 5.
Rotational symmetry of spatial periodicity. (A) Distribution of gsp score per subject determined based on the spectral method. We selected neurons with gsp scores >0.33, the 5% confidence interval of the randomized spatial ACs (SI Appendix, SI Experimental Procedures and Fig. S3H). (B) Distributions of angles of rotational symmetry from the two subjects over all environments using a 2° bin size. The n values indicate the number of data segments. (C, Left) Box and whisker plots for grid rotational symmetries observed in each environment color-coded according to environments. (C, Right) Rotated histograms show the composition of rotation symmetries according to the environment. Note that in addition to data segments displaying ∼60° rotational symmetries (black bracket), comparable numbers of data segments exhibited rotational symmetry at other angles (gray brackets). **P < 0.01, ***P < 0.001. (D) Angle of rotational symmetry negatively correlated with environment size. Significant differences in angles of rotational symmetry were found across environments, except between LV and LX, consistent between both subjects (SI Appendix, Tables S8.1–S8.5). Error bars represent angular variance (Subjects H and K, n = 214 and n = 213 segments, respectively).

