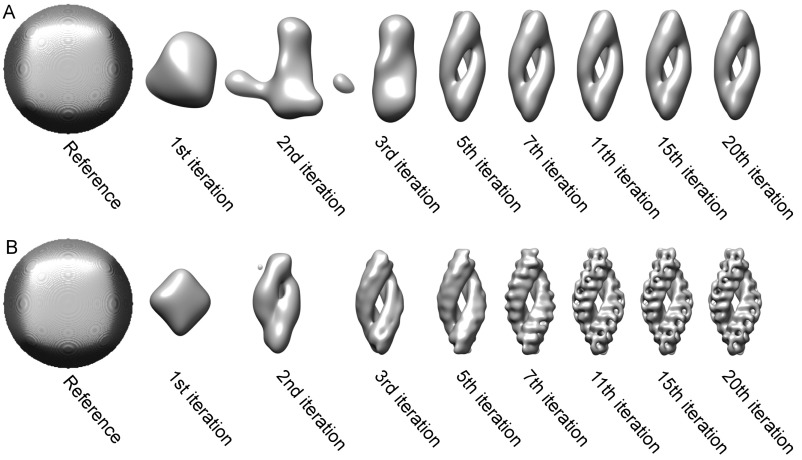
Fig. S4.
Evolution of density during subtomogram averaging before and after particle recentering. The sphere reference is generated by TOM toolbox. Several iterations were selected to illustrate the convergence of the subtomogram averaged structure within 20 iterations (Right). (A) First alignment before particle recentering. (B) First alignment after particle recentering.

