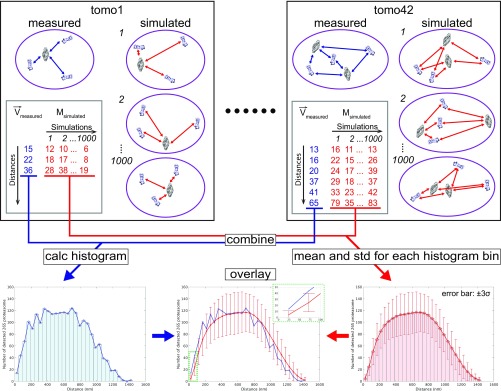
Fig. S7.
Scheme of spatial relation analysis between TPPII and 26S proteasome. The distances from TPPII complexes to all 26S proteasomes were measured in all tomograms (blue double-headed arrows). All measured distances (blue digits) were combined, and a histogram was calculated (Left Bottom). For the simulation, an equal number of coordinate points corresponding to TPPII and 26S proteasomes was randomly distributed in a cellular region corresponding to the same volume used for template matching. Then distances between simulated TPPII and 26S proteasomes were measured (red double-headed arrows). The simulation was repeated 1,000 times. All obtained distances from simulations (red digits) were combined, and the mean and SD were calculated for all histogram bins (Right Bottom). Both histograms, measured and simulated, were overlaid (Middle Bottom). Inset plot is region of interest indicated by green dashed line in overlaid plots.

