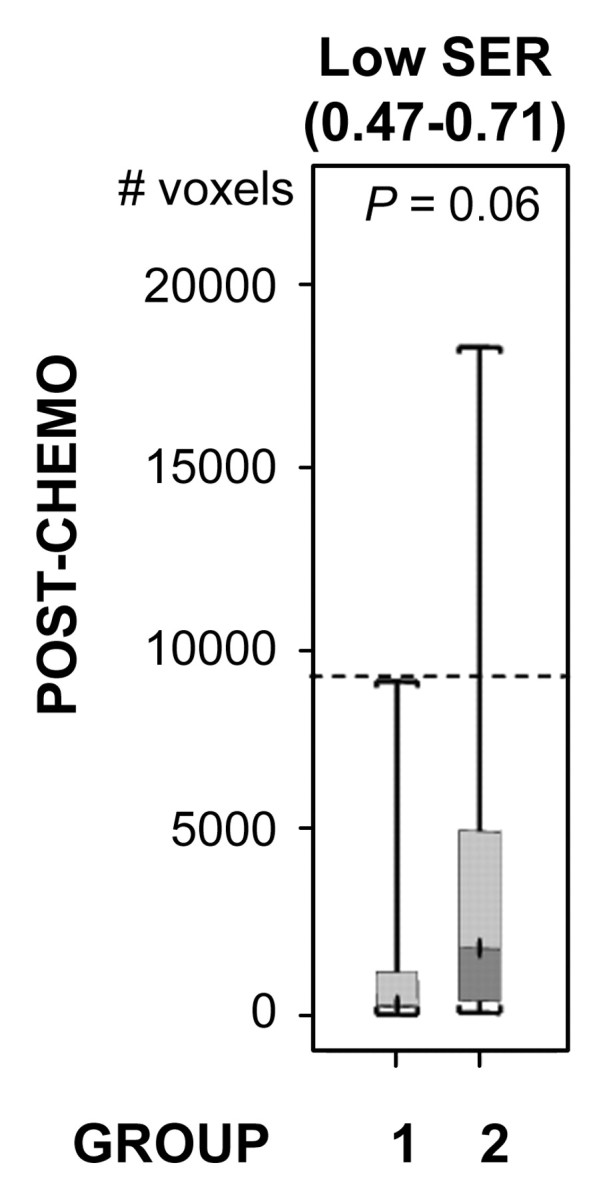
Figure 3d:

Comparison of the number of voxels with high (hypothesis 1) and low (hypothesis 2) SER between recurrence-free group (group 1) and recurrence group (group 2). Box-and-whisker plots (a–c) before chemotherapy and (d–f) after chemotherapy. (a, d) SER is between 0.47 and 0.71. (b, e) SER is greater than 1.45. (c, f) All voxels with nonzero SER. Interquartile range (ie, 25%–75%) is shown by box, extreme values are shown by whiskers, and median is shown by bar within the box. P value of the difference between the two groups was evaluated with Wilcoxon rank sum test. Dashed lines = cutoff criteria.
