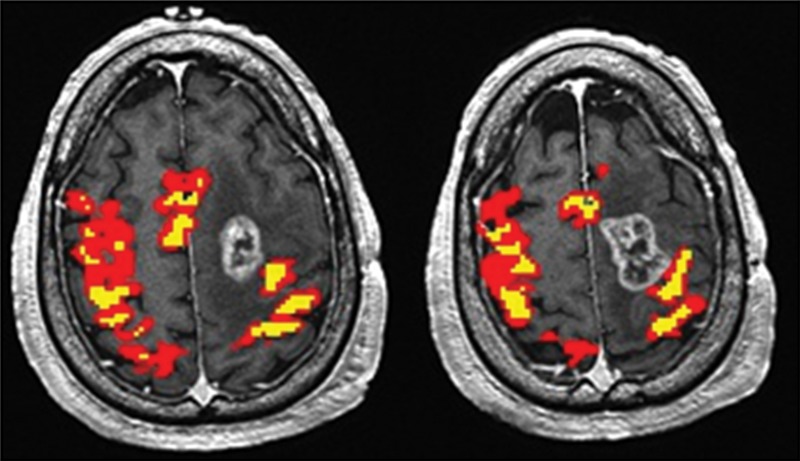
Figure 1:
Maps of BOLD functional MR imaging motor activation in a 59-year-old man with a GBM adjacent to the left PMC. Axial functional MR T2*-weighted gradient-echo echo-planar sequence images are superimposed on T1-weighted spin-echo anatomic reference images. Color = BOLD functional MR imaging activation following a range of r values (yellow, ≥0.1; 0.5 < red < 0.7). BOLD signal intensity reduction peaks in high-grade gliomas, as evidenced by the asymmetric BOLD functional MR imaging pattern in the hemisphere ipsilateral to the tumor.

