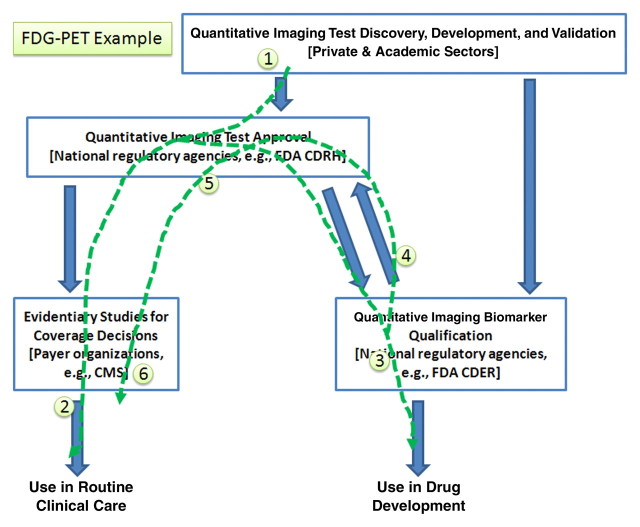
Figure 4:
Standardized uptake value in FDG PET serves as an example of how the interrelated activities outlined in Figure 1 may be pursued. This image may be read by itself, as well as compared with Figures 3 and 5 to highlight the differences in sequence that may be pursued by the community as appropriate for each marker. CMS = Centers for Medicare and Medicaid Services.

