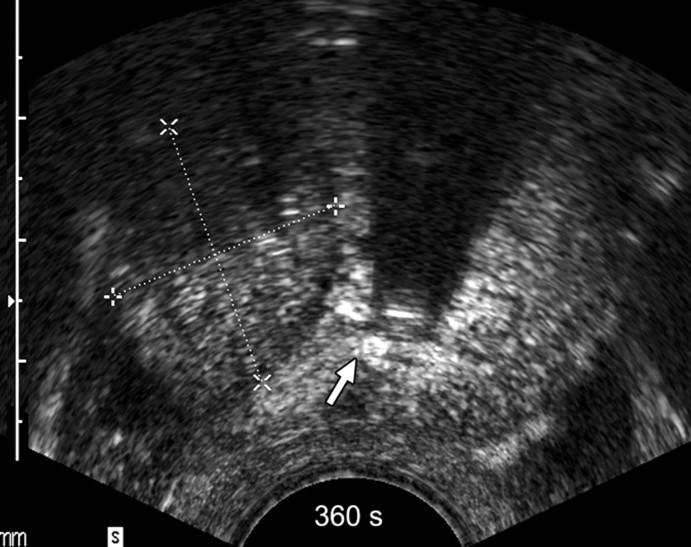
Figure 2f:
Sequential transverse contrast-enhanced perfusion images show the progression of the thermal coagulative tissue size on the right side of the prostate during 6 minutes of ablation at (a) 15, (b) 33, (c) 57, (d) 94, (e) 124, and (f) 360 seconds. Increasing echogenicity around the urethra is due to periurethral hyperemia (arrows). Note the artifact (arrowhead) due to RF interference from the electrode.

