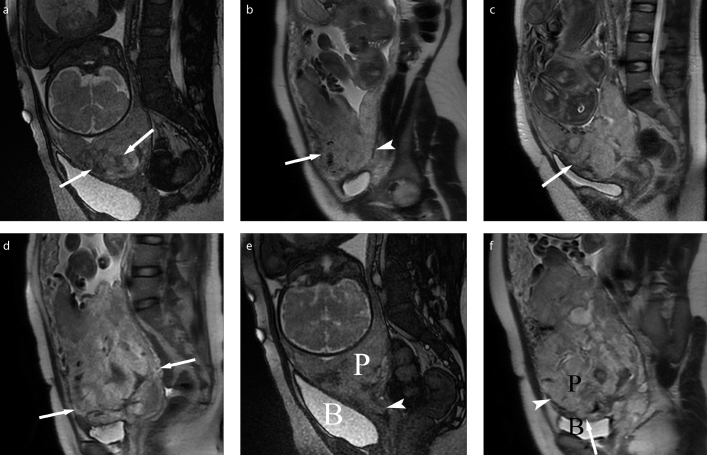
Figure 1. a–f.
Schematic diagram for the assessed imaging features. Panel (a) shows low signal intensity bands of placenta on T2-weighted imaging (white arrows). Panel (b) shows focally interrupted myometrial interface on the anterior wall of uterus (white arrow); the myometrial/placental interface were intact on the posterior wall of uterus (white arrowhead). Panel (c) shows heterogeneous signal intensity of placenta located on anterior uterine wall (white arrow). Panel (d) shows the bulging of the lower segment of the uterus (white arrow). Panel (e) shows placenta extending into the cervix indicating the placental protrusion sign (white arrowhead) (e). Panel (f) shows placenta infiltration into the wall of the bladder indicating the percreta (white arrow); the myometrial/placental interface was disrupted on the anterior wall of the uterus (white arrowhead). P, placenta; B, bladder.

