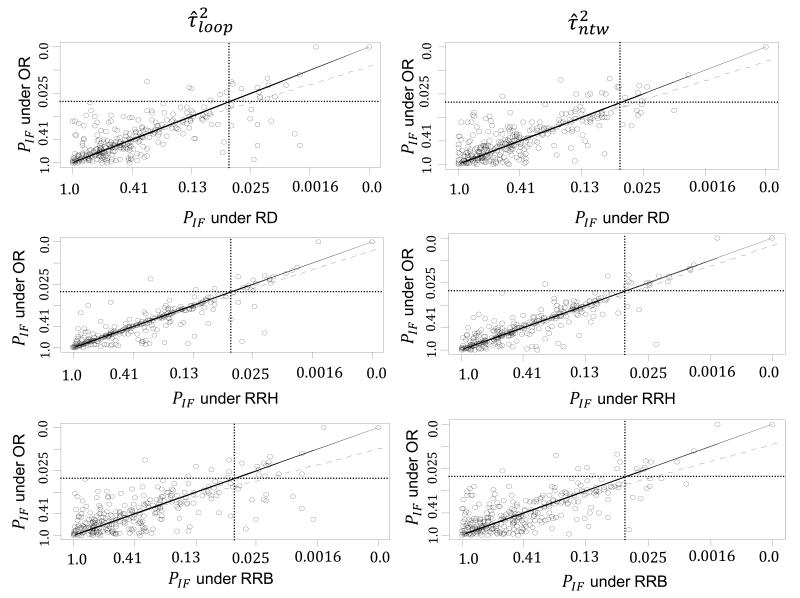
Figure 2.
Plot of the two sided P values of IF (fourth-root scale) for OR vs. RD, OR vs. RRH and OR vs. RRB effect measures under the DerSimonian and Laird method for and the restricted maximum likelihood for . The solid diagonal line indicates equality, the dashed diagonal line is the regression line and the two dotted horizontal and vertical lines represent the P=0.05 threshold lines. RD is the risk difference measure, RRH is the risk ratio for harmful outcomes, RRB is the risk ratio for beneficial outcomes and OR is the odds ratio.

