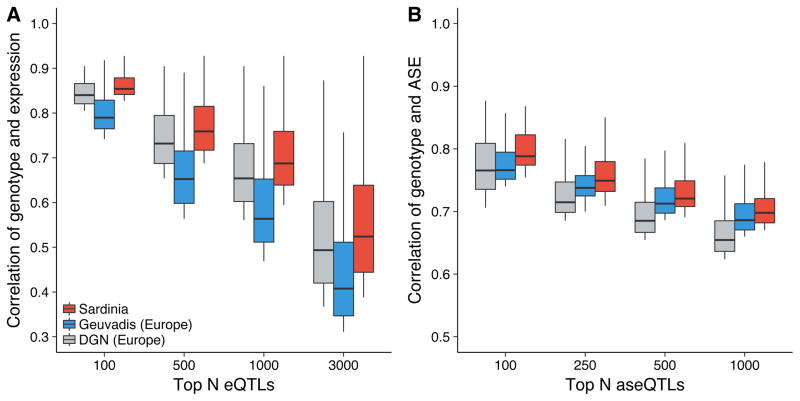
Figure 1. QTLs show larger effect sizes in Sardinia compared to Europe.
The distribution of Spearman correlation coefficients (absolute value) is shown for (a) top expression QTLs (eQTLs) and (b) top allele-specific expression QTLs (aseQTLs) in Sardinia, Geuvadis, and DGN. Top eQTLs and aseQTLs in Sardinia show increased correlations relative to Geuvadis and DGN. To make analyses comparable across studies, 188 unrelated individuals from each study were uniformly processed and analyses were performed on a subset of genes that were quantifiable in all three studies.

