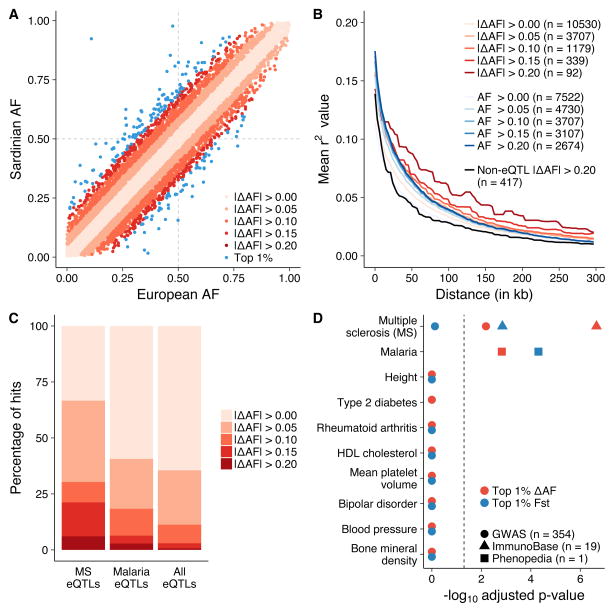
Figure 2. Differentiated eQTLs in Sardinia.
(a) Sardinian eQTLs are plotted based on their allele frequency in Europe (measured in the 1000 Genomes Project) and Sardinia. Blue points represent eQTLs in the top 1% of the |ΔAF| distribution. Sample sizes: |ΔAF| > 0.00 (n = 19,108 eQTLs), > 0.05 (n = 6,793), > 0.10 (n = 2,151), > 0.15 (n = 567), > 0.20 (n = 134), and Top 1% (n = 192). (b) eQTLs with larger allele frequency differences compared to Europe have longer tracts of LD decay as potential evidence for recent positive selection. These are compared to eQTLs that have comparable allele frequencies in Sardinia and Europe (allele frequencies within ±2.5%; blue lines) as well as randomly selected, distance to TSS-matched, non-eQTL variants with large allele frequency changes (black line). (c) eQTLs linked to multiple sclerosis variants and malaria-associated genes are both enriched in allele frequency difference changes between Sardinia and Europe. (d) The significance of the top ten trait enrichments for differentiated eQTLs (red = ΔAF, blue = FST) after Bonferroni correction for all possible tests. Traits with less than 10 eQTLs in LD were filtered out.

