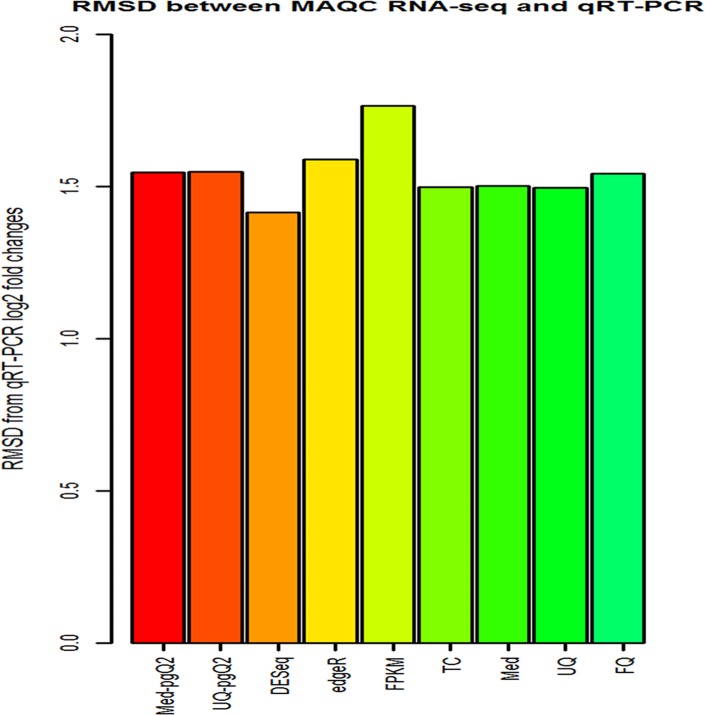
Fig 2. RMSD (root-mean-square deviation) between the log2 expression fold changes of MAQC2 and qRT-PCR.
Illustrated is the RMSD between the log2 fold changes computed from DEGs based on different methods and the values computed from qRT-PCR. FPKM (yellow) has the least similarity while DESeq normalization (brown) has the highest one.

