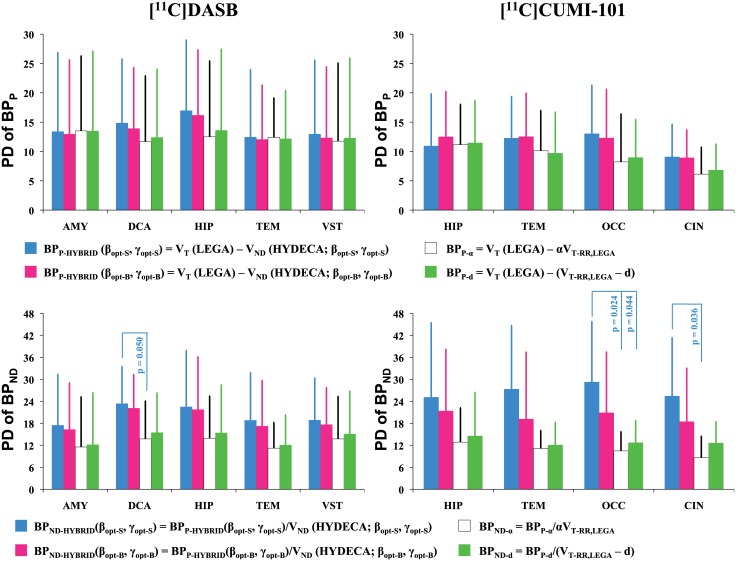
Fig 7. Reproducibility of binding potentials estimated using HYDECA and alternative strategies based on blocking studies.
Average plus standard deviation (across test-retest pairs of scans within each tracer) test-retest percent difference PDBPP values calculated in each of the considered region for [11C]DASB (left) and [11C]CUMI-101 (right), using BPP based on VND from HYDECA, BPP based on scaled VT-RR,LEGA, and BPP based on average distance d (top). Corresponding values for test-retest percent difference PDBPND (bottom). Statistically significant comparisons (p-value ≤ 0.05) are indicated. AMY: amygdala; CIN: cingulate; DCA: dorsal caudate; HIP: hippocampus; OCC: occipital lobe; TEM: temporal lobe; VST: ventral striatum; PDBPP: percent difference for BPP; PDBPND: percent difference for BPND; VND: non-displaceable distribution volume; VT-RR,LEGA: tracer total distribution volume in the non-ideal reference region estimated using LEGA; LEGA: Likelihood Estimation in Graphical Analysis.

