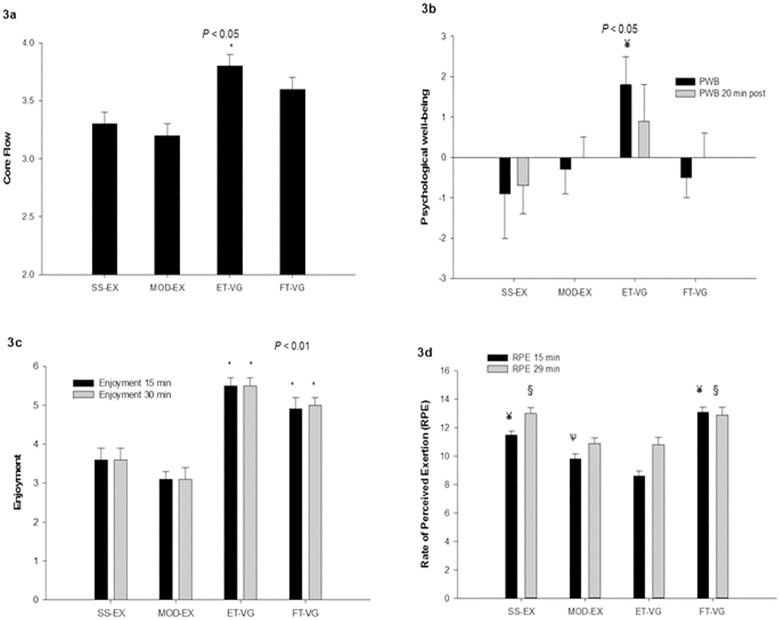
Fig 3.
A. State of core flow immediately after the trials. All data presented as mean ± SEM. *significantly different than SS-EX and MOD-EX, P < 0.05. b Differences in psychological well-being before and immediately after the trials (PWB post diff) and before and 20 min after trial completion (PWB 20 min post diff). ¥ significantly different than all other trials, P < 0.05. c Enjoyment at 15 and 29 min, and average scores. *significantly different than SS-EX and MOD-EX, P < 0.01. d. Rate of perceived exertion (RPE) at 15 and 29 min and average scores. ¥ significantly different than all other trials, P < 0.05; ѱ significantly different than ET-VG, P < 0.05;.§ significantly different than MOD-EX and ET-VG, P < 0.01. All data presented as mean ± SEM.

