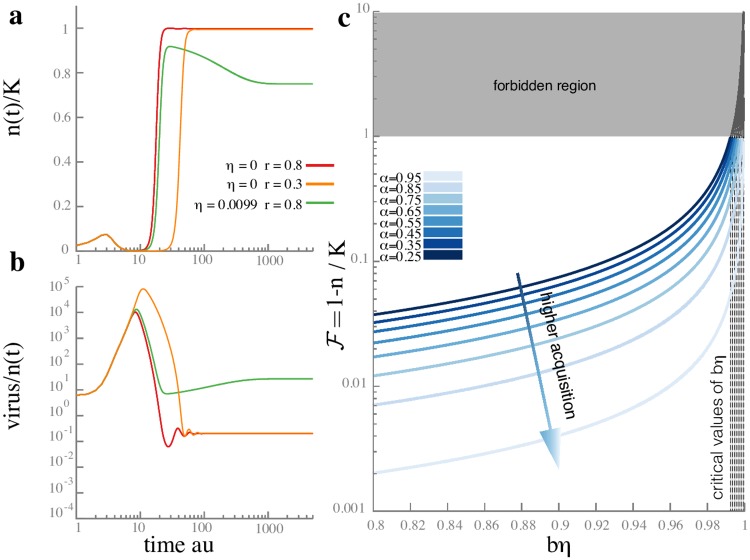
Fig 3. Model of bacteria with a single spacer in the presence of lytic phage.
(Panel a) shows the dynamics of the bacterial concentration in units of the carrying capacity K = 105 and (Panel b) shows the dynamics of the phage population. In both panels, time is shown in units of the inverse growth rate of wild type bacteria (1/f0) on a logarithmic scale. Parameters are chosen to illustrate the coexistence phase and damped oscillations in the viral population: the acquisition probability is α = 10−4, the burst size upon lysis is b = 100. All rates are measured in units of the wild type growth rate f0: the adsorption rate is g/f0 = 10−5, the lysis rate of infected bacteria is μ/f0 = 1, and the spacer loss rate is κ/f0 = 2 × 10⁻³. The spacer failure probability (η) and growth rate ratio r = f1/f0 are as shown in the legend. The initial bacterial population was all wild type, with a size n(0) = 1000, while the initial viral population was v(0) = 10000. The bacterial population has a bottleneck after lysis of the bacteria infected by the initial injection of phage, and then recovers due to CRISPR immunity. Accordingly, the viral population reaches a peak when the first bacteria burst, and drops after immunity is acquired. A higher failure probability η allows a higher steady state phage population, but oscillations can arise because bacteria can lose spacers (see also S1 File). (Panel c) shows the fraction of unused capacity at steady state (Eq 6) as a function of the product of failure probability and burst size (ηb) for a variety of acquisition probabilities (α). In the plots, the burst size upon lysis is b = 100, the growth rate ratio is f1/f0 = 1, and the spacer loss rate is κ/f0 = 10−2. We see that the fraction of unused capacity diverges as the failure probability approaches the critical value ηc ≈ 1/b (Eq 7) where CRISPR immunity becomes ineffective. The fraction of unused capacity decreases linearly with the acquisition probability following (Eq 6).

