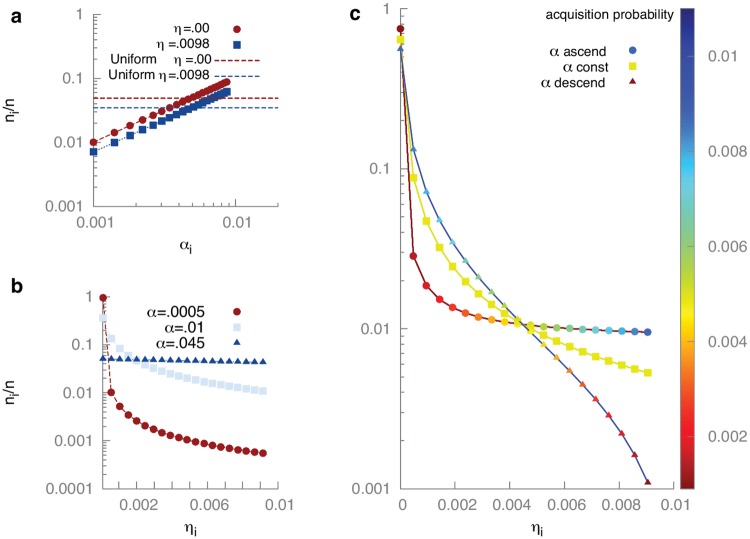
Fig 4. The distribution of bacteria with 20 spacer types.
In these simulations, 100 phage are released upon lysis (burst size b = 100) and the carrying capacity for bacteria is K = 105. All rates are measured in units of the bacterial growth rate f: the lysis rate is μ/f = 1, the phage adsorption rate is g/f = 10−4, the spacer loss rate is κ/f = 10−2. (Panel a) Distribution of spacers as a function of acquisition probability αi given a constant failure probability ηi = η. (Eq 10) shows that the abundance depends linearly on the acquisition probability: ni/n ∝ αi/α. Horizontal lines give the reference population fraction of all spacers if they all have the same acquisition probability with the indicated failure probability η. (Panel b) Distribution of bacteria with different spacers as a function of failure probability ηi given a constant acquisition probability αi = α/20. For small α, the distribution is highly peaked around the best spacer while for large α it becomes more uniform. (Panel c) The distribution of spacers when both the acquisition probability αi and the failure probability ηi vary. The three curves have the same overall acquisition rate α = ∑i αi = .0972. The color of the dots indicates the acquisition probability and the x-axis indicates the failure probability of each spacer. When the acquisition probability is constant (green curve i.e. αi = α/20) the population fraction of a spacer is determined by its failure probability. If the acquisition probability is anti-correlated with the failure probability (blue curve), effective spacers are also more likely to be acquired and this skews the distribution of spacers even further. If the acquisition probability is positively correlated with the failure probability (red curve), more effective spacers are less likely to be acquired. Despite this we see that the most effective spacer still dominates in the population.

