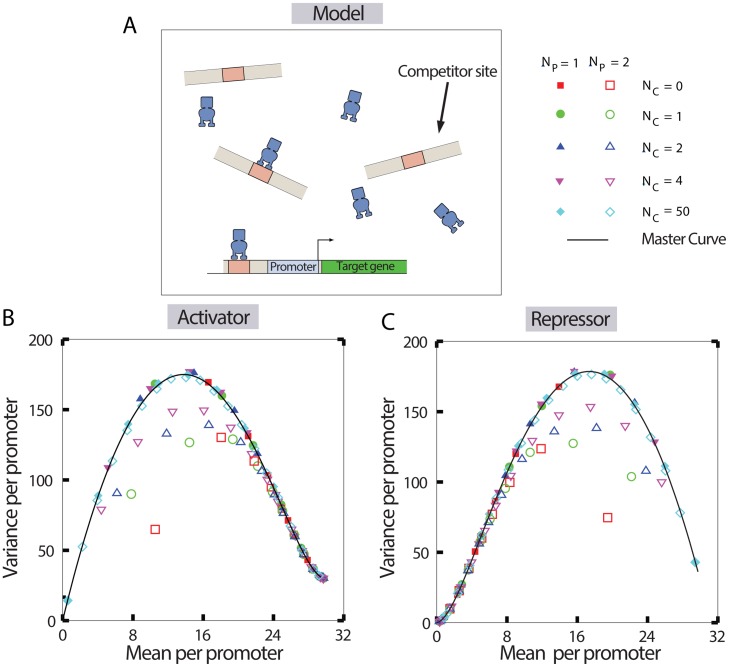
Fig 4. Prediction of mRNA variance as a function of mean, when the promoters share TFs with other competitor sites.
(A) Schematic of a single target promoter sharing TFs with multiple competitor sites. (B) The variance of mRNA molecules per promoter (var(m)/NP) versus the mean per promoter (〈m〉/NP), when the TFs act as activators. (C) The mRNA variance per promoter versus mean per promoter when the TFs act as repressors. In both the subfigures B and C, different numerical data points are obtained for various numbers of competitor sites by varying the TF copy number. Note that all the data for a single target promoter collapse onto a master curve (black curve). Data for a single target promoter is shown by closed symbols, and the data for two target promoters are shown by open symbols. The parameters related to the promoters (kon, koff, r, γ) are taken from the Table 1, while the number of competitor sites are systematically varied and listed in the figures. The master curves are predictions from Eq 3.

