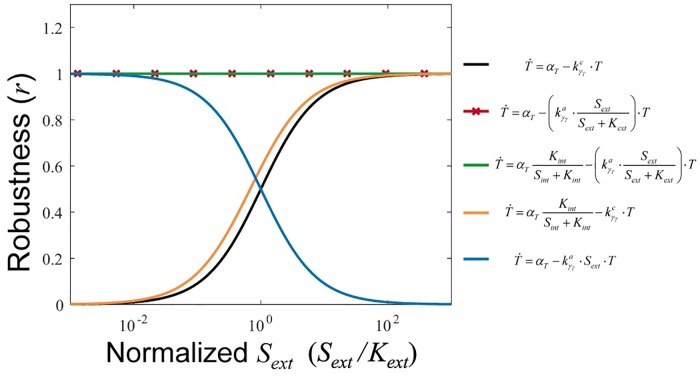
Fig 2. Homeostasis by activity-dependent transporter downregulation.
The steady-state internal nutrient concentration for a range of external nutrient concentrations is plotted for six different instantiation of the system in Eq (3): no transporter regulation (black), flux-based transporter downregulation (red with x's), internal nutrient based repression of transporter synthesis (orange), linear external nutrient based transporter downregulation (blue), flux-based transporter downregulation plus internal nutrient based repression of transporter synthesis (green). This illustrates the criterion from Eq (4), which states that the system can only achieve global perfect homeostasis (red and green lines) when flux-based transporter downregulation () is combined with an arbitrary function of the internal nutrient concentration (Sint).

