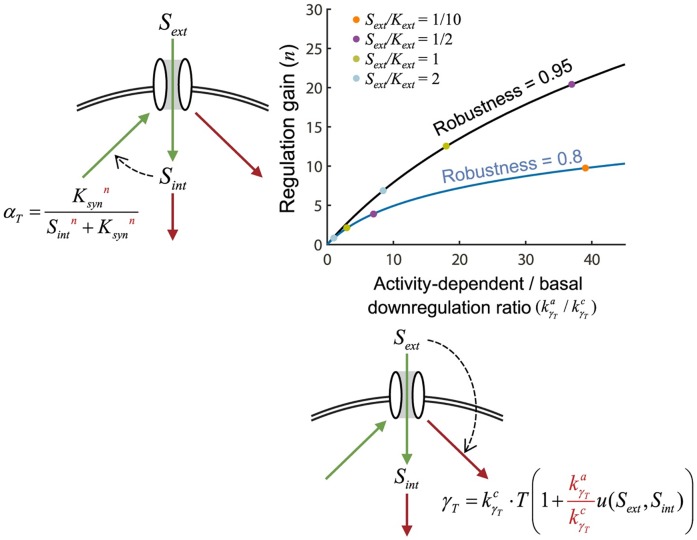
Fig 7. Comparison of internal nutrient-dependent regulation of transporter synthesis and activity-dependent transporter downregulation.
For different normalized concentrations of Sext, the values of n and required to achieve either 0.8 or 0.95 robustness (blue curve and black curve respectively) are plotted. Four different specific normalized Sext values are represented by the four colored dots. We assumed nutrient uptake per transporter was Michaelian .

