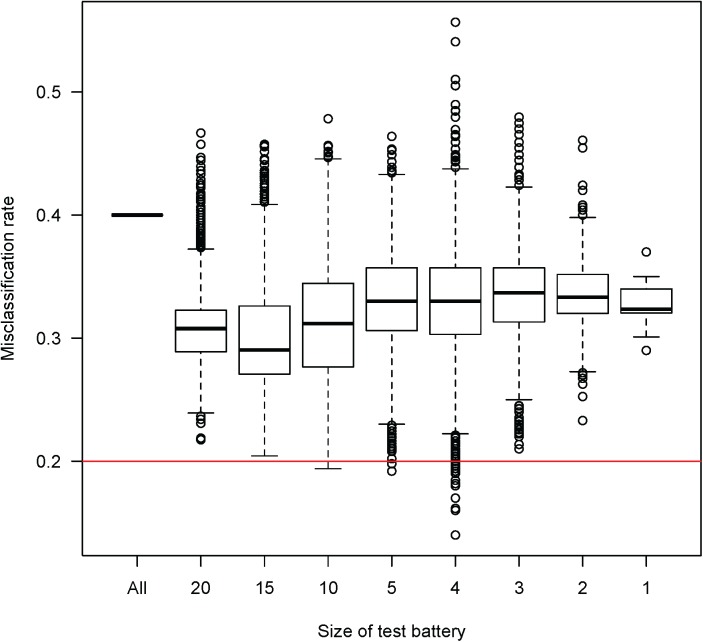
Fig 3. Misclassification rates for different sizes of test batteries.
Misclassification rates for about 72 000 test batteries of different sizes, representing different combinations of the included test variables. The size of the test battery is the number of included variables. The misclassification rate should be as low as possible. The results for combinations consisting of 5, 10, 15 and 20 variables are based on 10000 random samples. The horizontal line indicates our threshold (0.2) for the highest acceptable misclassification rate.

