Figure 1.
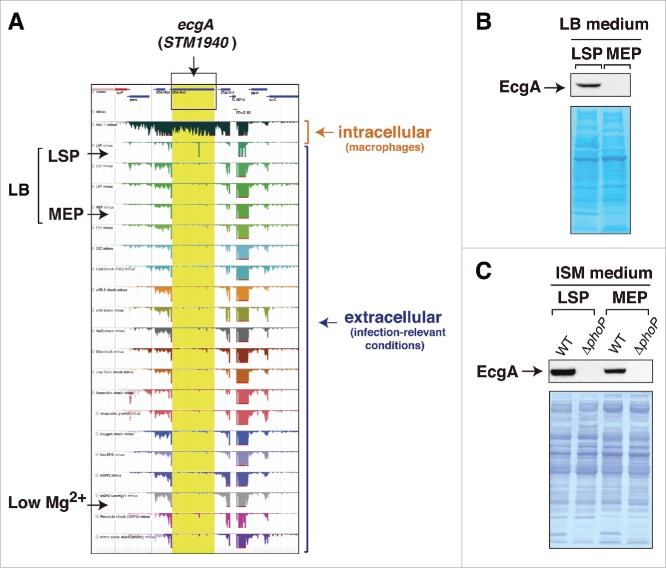
Disparity between RNA-Seq data and those obtained at the protein level for the ecgA (STM1940) gene of S. Typhimurium. (A) expression profiles obtained by RNA-Seq for the genomic region in which ecgA is located. These profiles were obtained from intracellular bacteria following infection of macrophages (see Srikumar et al.)10 and from bacteria grown in media mimicking different infection-relevant conditions (see Kröger et al.)8 The image was mounted from the publicly available S. Typhimurium gene expression compendium (http://bioinf.gen.tcd.ie/cgi-bin/salcom.pl?db = salcom_mac_HL); (B) EcgA protein levels detected in bacteria grown in LB medium up to late stationary phase (LSP) or medium exponential phase (MEP); (C) EcgA levels in bacteria grown in ISM minimal medium to LSP and MEP. Protein extracts were prepared from wild-type (WT) and a ΔphoP mutant. Note the absence of reads in the RNA expression profile for ecgA (STM1940) in the LB medium-LSP and in low Mg2+ medium, conditions in which the EcgA protein is produced (see also Rico-Pérez et al.).12 In concordance with transcriptomic data obtained from intracellular S. Typhimurium isolated from fibroblasts31 and the RNA-Seq data obtained in bacteria infecting macrophages,10 EcgA protein levels increase notoriously in intracellular bacteria by a regulation mediated by the PhoP-PhoQ two-component system (see Rico-Pérez et al.)12.

