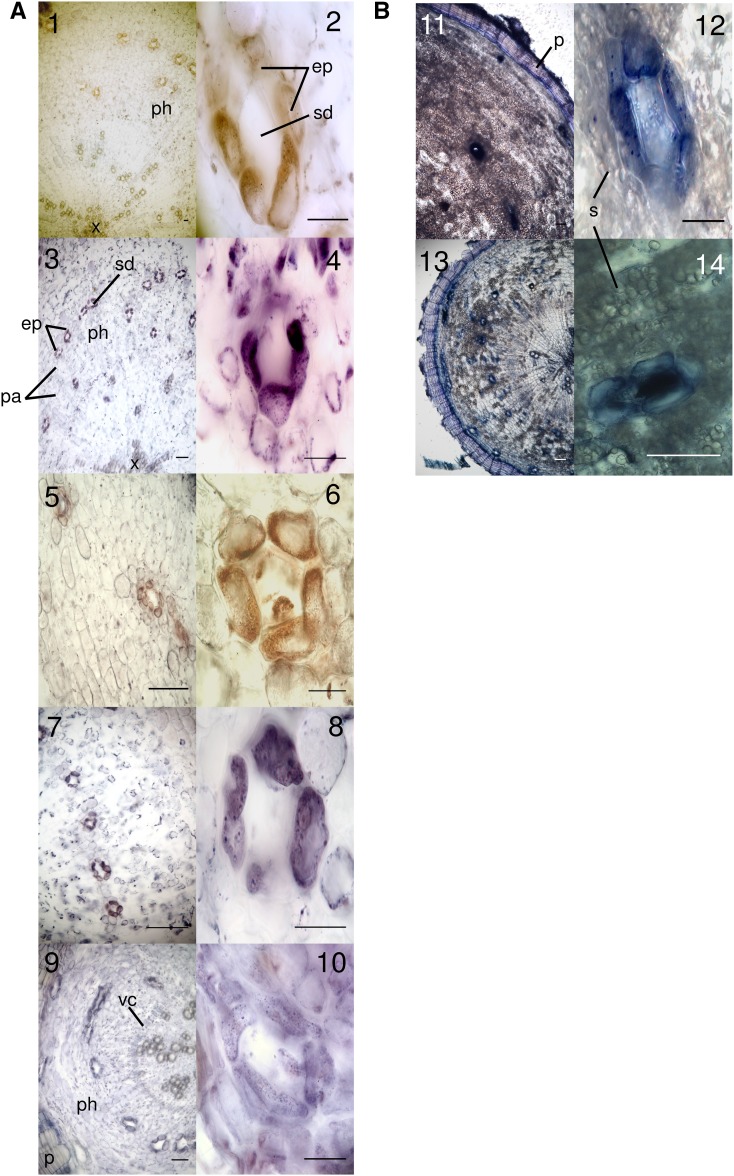
Figure 6.
A, In situ PCR of TgCYP76AE2 and TgSTS2 in T. garganica root cross sections. All samples were stained with BM Purple. Blue/purple color indicates the presence of digoxigenin (DIG)-labeled cDNA, and brown indicates the absence of the amplified cDNA target. Images 1 and 2 are negative controls (TgCYP76AE2) where reverse transcription was omitted. Images 3 and 4 show the detection of TgCYP76AE2 mainly in epithelial cells surrounding secretory ducts within the vascular cambium. Images 5 and 6 are negative controls (TgTPS2) where reverse transcription was omitted. Images 7 and 8 show the detection of TgTPS2 mainly in epithelial cells surrounding secretory ducts within the vascular cambium, as with TgCYP76AE2. Images 9 and 10 are positive controls with 18S rRNA to show staining in all cell types. B, NADI staining of T. garganica root cross sections. In images 11 to 14, blue indicates the presence of oxygenated or lipophilic compounds (e.g. terpenoids) concentrated in epithelial cells and secretory ducts. ep, Epithelial cells; p, periderm; ph, phloem; pa, parenchyma cells; s, starch grains; sd, secretory ducts; vc, vascular cambium; x, xylem. Bars = 100 μm.

