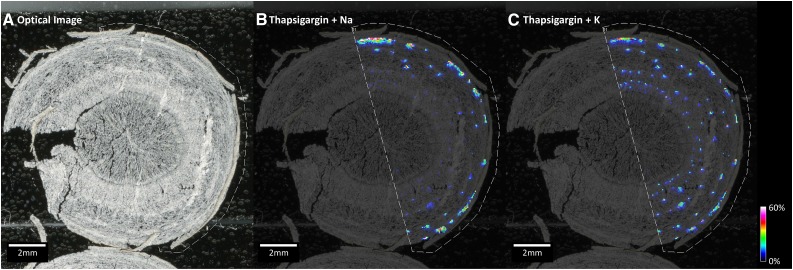
Figure 7.
MALDI-MSI analysis of a T. garganica taproot section. A, Optical image of a taproot section with sublimed DHB matrix. B, Distribution of thapsigargin Na adduct, [M+Na]+ m/z 673.3186 (calculated 673.31945, 1.26 ppm error). C, Distribution of thapsigargin K adduct, [M+K]+ m/z 689.2924 (calculated 689.29339, 1.43 ppm error). Images were normalized to root median square and scaled to 0% to 60% of maximum signal intensity using Compass FlexImaging 4.1 to enhance visualization. The results demonstrate thapsigargin to be localized to concentric circles similar to the pattern of secretory ducts.

