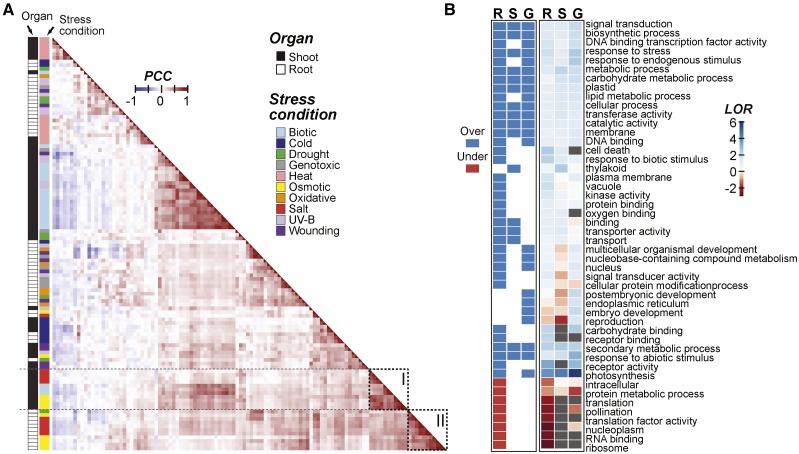
Figure 1.
Arabidopsis gene expression correlation across stress data sets and Gene Ontology (GO) terms enriched in salt-responsive genes. A, Between-sample Pearson’s correlation coefficient (PCC) calculated based on log2 fold change (log2[stress treatment/control]) of genes in shoot and root samples under each stress condition/treatment duration combination. The orders of rows and columns are the same, and they are sorted based on hierarchical clustering of the pairwise PCC values. Dotted rectangles I and II highlight osmotic and salt stress clusters, respectively. B, Heat map indicating GO slim terms significantly overrepresented (blue) or underrepresented (red) in genes that are differentially up-regulated during salt stress after 3 h in root only (R), shoot only (S), or globally in both organs (G; log2 fold change > 1, P ≤ 0.05). The heat map at right summarizes the log2 odds ratio (LOR) from the enrichment test (gray, LOR cannot be calculated).

