Figure 2.
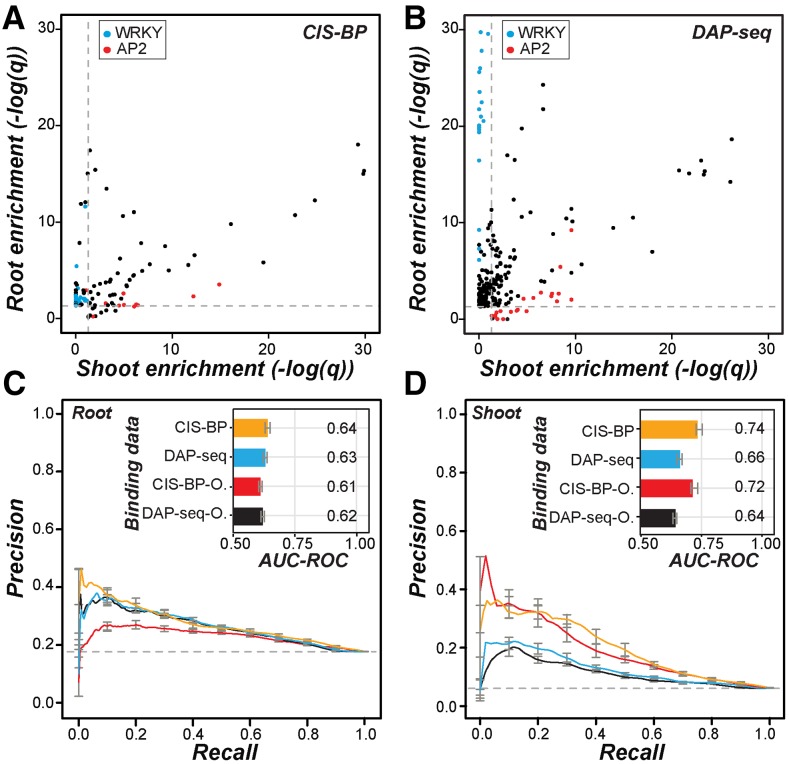
Overrepresentation of known TF binding sites in organ salt up-regulated genes and performance of in vitro TF binding data in predicting salt up-regulation. A, Scatterplot of the enrichment score [–log(q)] of CIS-BP TFBM sites in the promoters of root (y axis) and shoot (x axis) up-regulated genes compared with nonresponsive genes. Each point is for one TFBM. Blue, WRKY family TFs; red, AP2 family TFs. Dotted lines indicate the q value threshold at 0.05. B, As in A but using DAP-seq data. Each point is for one TF. C, Precision-recall curves and AUC-ROCs (inset) of CRCs predicting root up-regulated genes using CIS-BP TFs (orange) or DAP-seq TFs (blue). O, CIS-BP and DAP-seq sites overrepresented among root up-regulated genes indicated in red and black, respectively. The colors of the precision-recall curves correspond to the colors for binding data subsets in the AUC-ROC bar chart. Error bars correspond to the se from 10-fold cross-validation for each model. D, As in C but for shoot up-regulated genes.

