Figure 6.
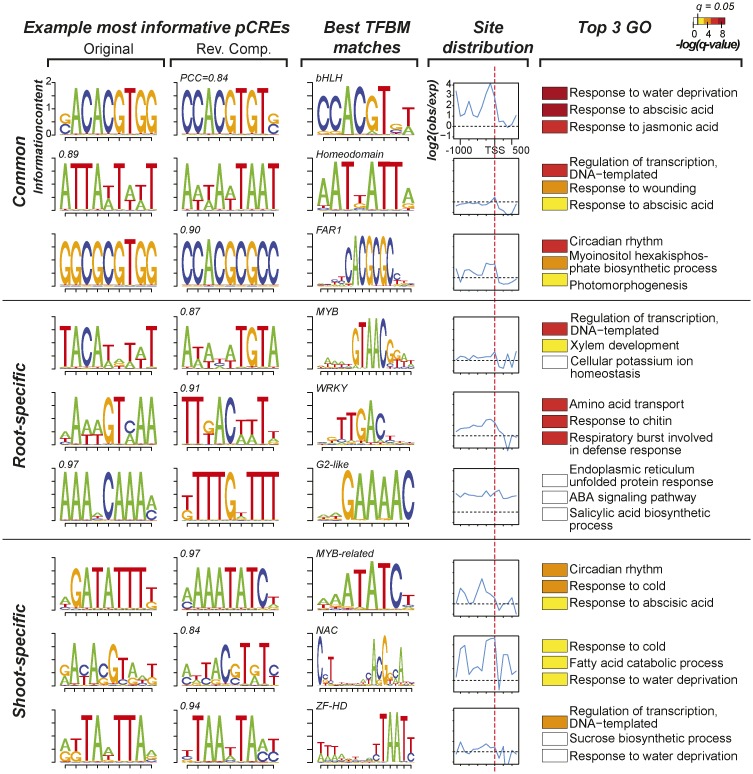
Characteristics of pCREs important in predicting organ salt up-regulation. Example pCREs from the most important 39 root and 40 shoot pCREs are shown. The top, middle, and bottom rows contain three common, three root-specific, and three shoot-specific pCREs, respectively. The first and second columns show sequence logo representations of the pCREs and their corresponding reverse complement (Rev. Comp.) motifs, respectively. The PCC value between a pCRE and its best matching TFBM is shown above the sequence logo. The third column contains sequence logos and the TF family of the best matching TFBMs for the pCREs listed. The fourth column shows the degrees of pCRE site enrichment (log2[observed number of pCRE sites/randomly expected number]) from 1 kb upstream of the TSS (dotted red line) to 500 bp downstream. The fifth column shows the top three enriched GO Biological Process categories containing genes with sites of the pCRE in question. For the color bar at top [-log(q-value)], the q value is derived from the P value of FET after multiple testing correction; white indicates values below the 5% significance level.

