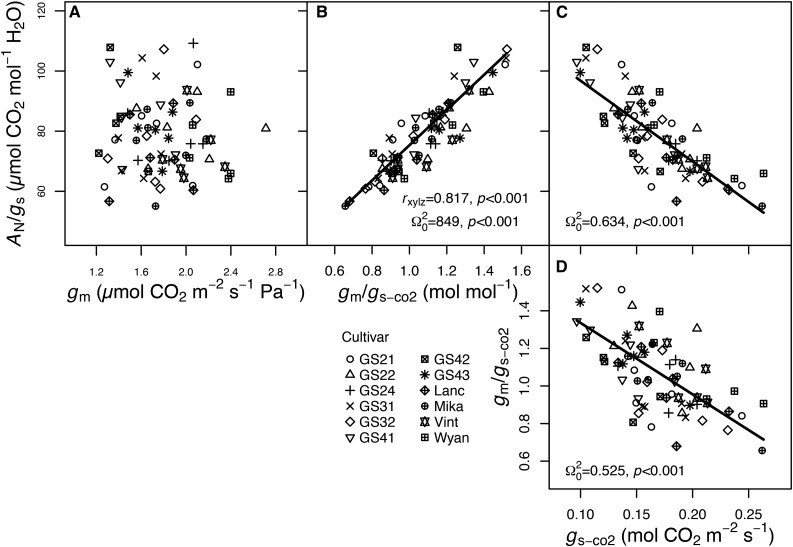
Figure 2.
Relationships between AN/gs and gm (A), gm/gs-co2 (B), and gs-co2 (C) and between gm/gs-co2 and gs-co2 (D) for the 12 soybean cultivars in the controlled environment experiment. Different symbols represent the different cultivars as indicated (n = 5–6 replicates). Regression lines, Ω20, and P values are from linear mixed-effects models. In B, the partial correlation (rxy|z) of AN/gs with gm/gs-co2 after accounting for gs also is presented.

