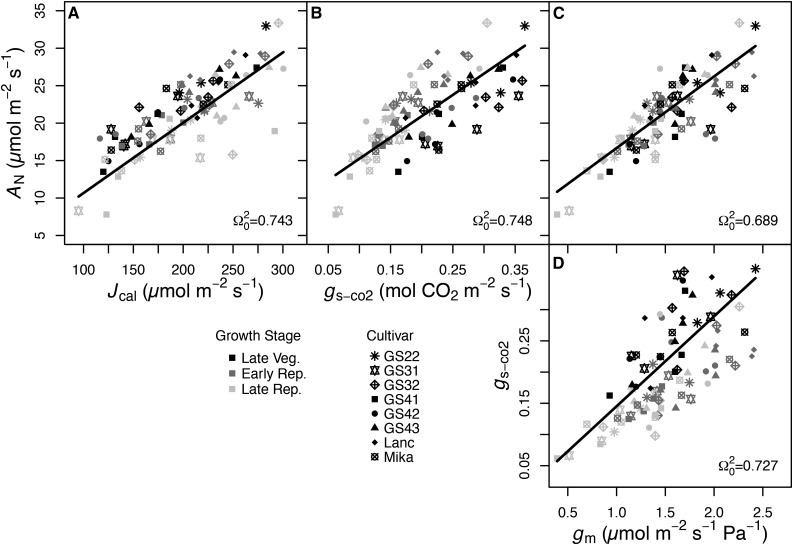
Figure 4.
Relationships between steady-state AN and total Jcal (A), AN and gs-co2 (B), AN and gm (C), and gs-co2 and gm (D). Data are from the eight soybean cultivars in the field experiment and measured at the late vegetative (V5 and V6; black symbols), early reproductive (R2–R4; dark gray symbols), and late reproductive (R6; light gray symbols) growth stages. Different symbols represent different cultivars as indicated, with n = 4 replicates for each cultivar-growth stage combination except GS22, where n = 3. Ω20 and regression lines are from linear mixed-effects models with the x variable and growth stage as predictors and cultivar treated as a random effect (P < 0.001 for all).

