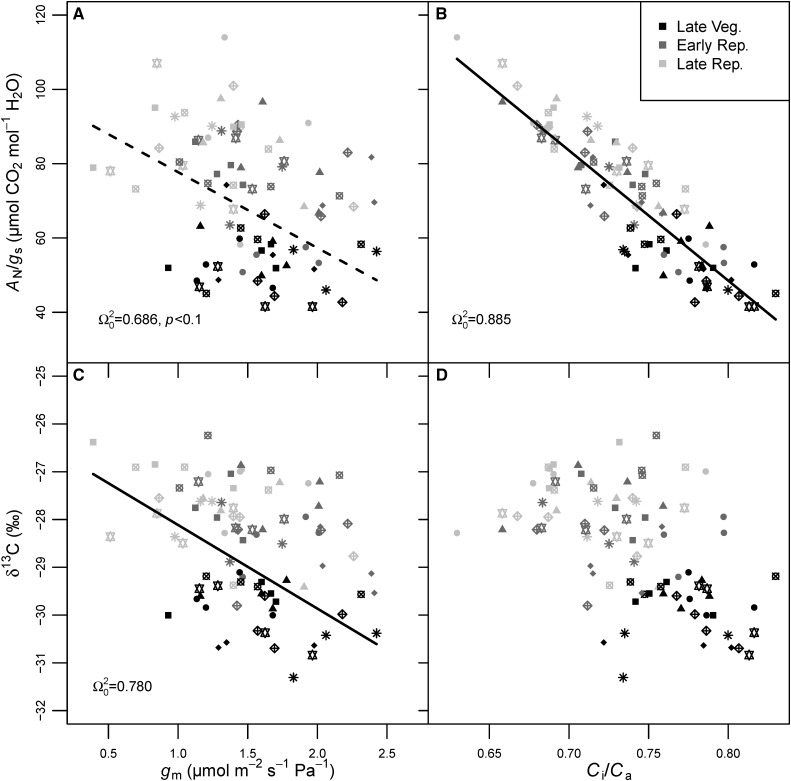
Figure 5.
Relationships between AN/gs and gm (A), AN/gs and Ci/Ca (B), δ13C and gm (C), and δ13C and Ci/Ca (D) from the field experiment. Different symbols represent different cultivars (see Fig. 4 legend) with n = 4 replicates, and shading represents late vegetative (V4 and V5; black symbols), early reproductive (R2–R4; dark gray symbols), and late reproductive (R6; light gray symbols) growth stages. The dashed line is marginally significant (P < 0.1), while the solid lines are significant (P < 0.05), according to linear mixed-effects models with growth stage and the variable on the x axis as fixed effect predictors and cultivar identity as a random effect. In all cases, growth stage was a significant predictor (P < 0.001). Cultivar identity significantly improved model fit in C and D (P < 0.001).

