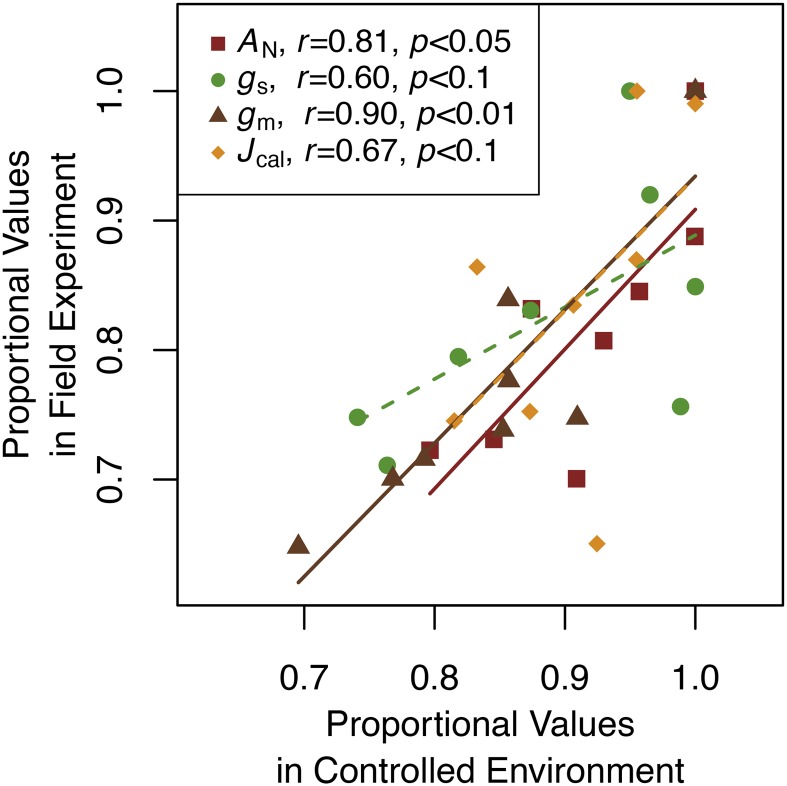
Figure 6.
Consistency among estimates of AN, gs, gm, and Jcal for late vegetative (V2–V4) growth stage soybean plants grown in a controlled environment or in the field. Symbols are cultivar-mean values standardized as a proportion of maximum cultivar-mean trait values. Correlations and P values are Spearman-rank correlations adjusted for multiple comparisons. Solid lines indicate significant relationships (P < 0.05), and the dashed line is marginally significant (P < 0.1).

