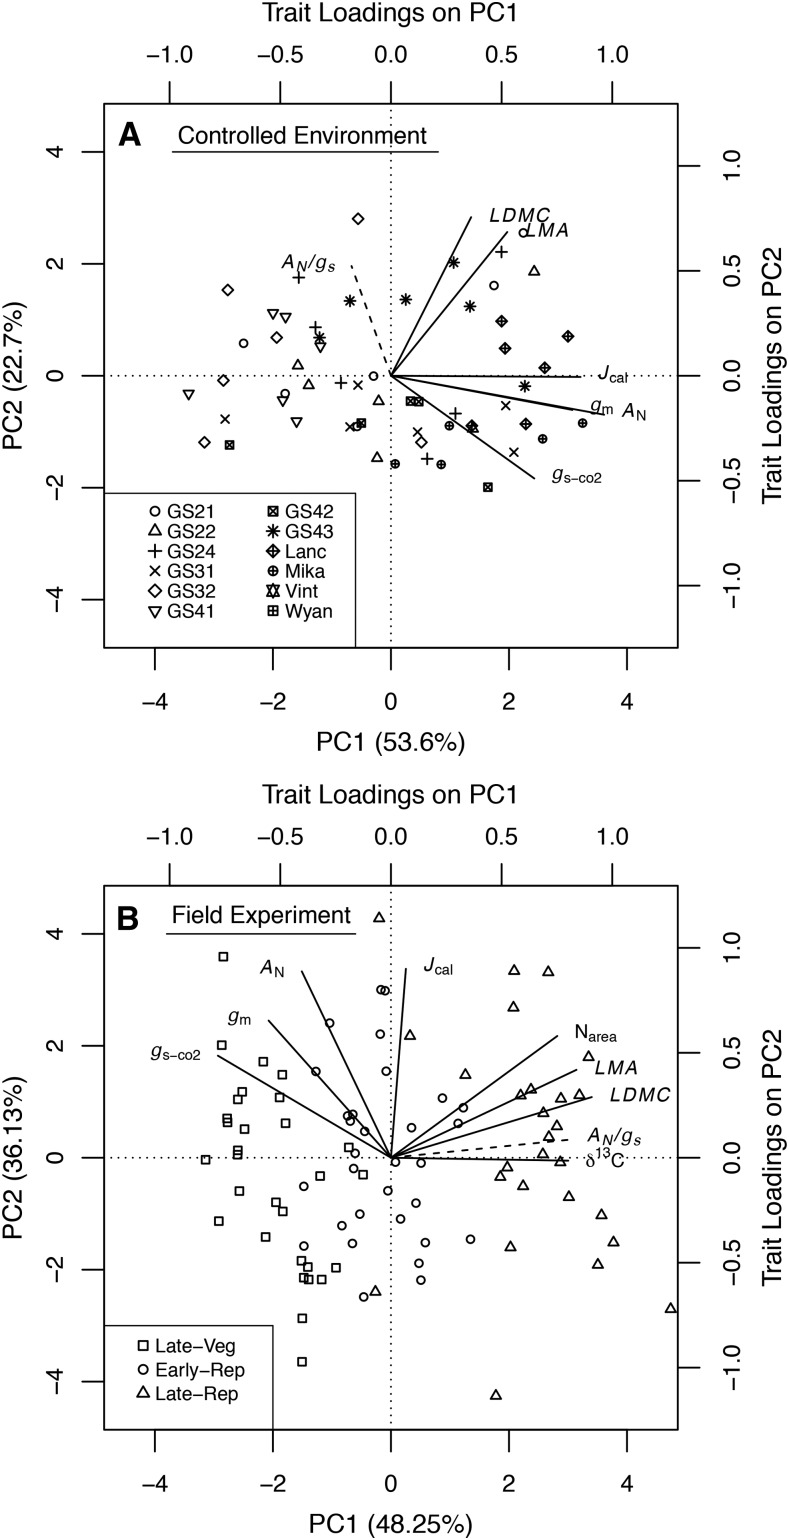
Figure 7.
Principal component analyses for the main traits investigated here from the controlled environment experiment on 12 cultivars of soybean (A) and the field experiment on eight of the same cultivars (B). AN, gs-co2, gm, Jcal, LMA, and LDMC were used in the fitting in A and B. Additionally, in B, Narea and δ13C were used in the fitting. AN/gs (dashed lines) was mapped in the trait space in both A and B. In A, different symbols indicate different cultivars, while in B, they indicate different soybean growth stages.

