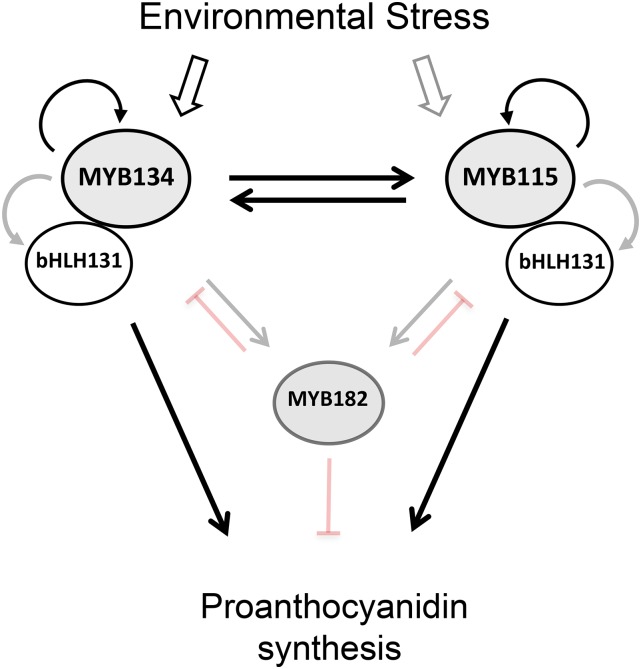
Figure 9.
Schematic summarizing positive and negative interactions among transcription factors known to regulate PA synthesis in poplar. Heavy black lines indicate activation demonstrated both via transient expression assays and in transgenic MYB-overexpressing plants, while gray lines indicate the up-regulation observed in transgenic overexpressor plants only. Light black lines indicate interactions shown by transient activation only. Inhibitory interactions with MYB182 are from Yoshida et al. (2015).

