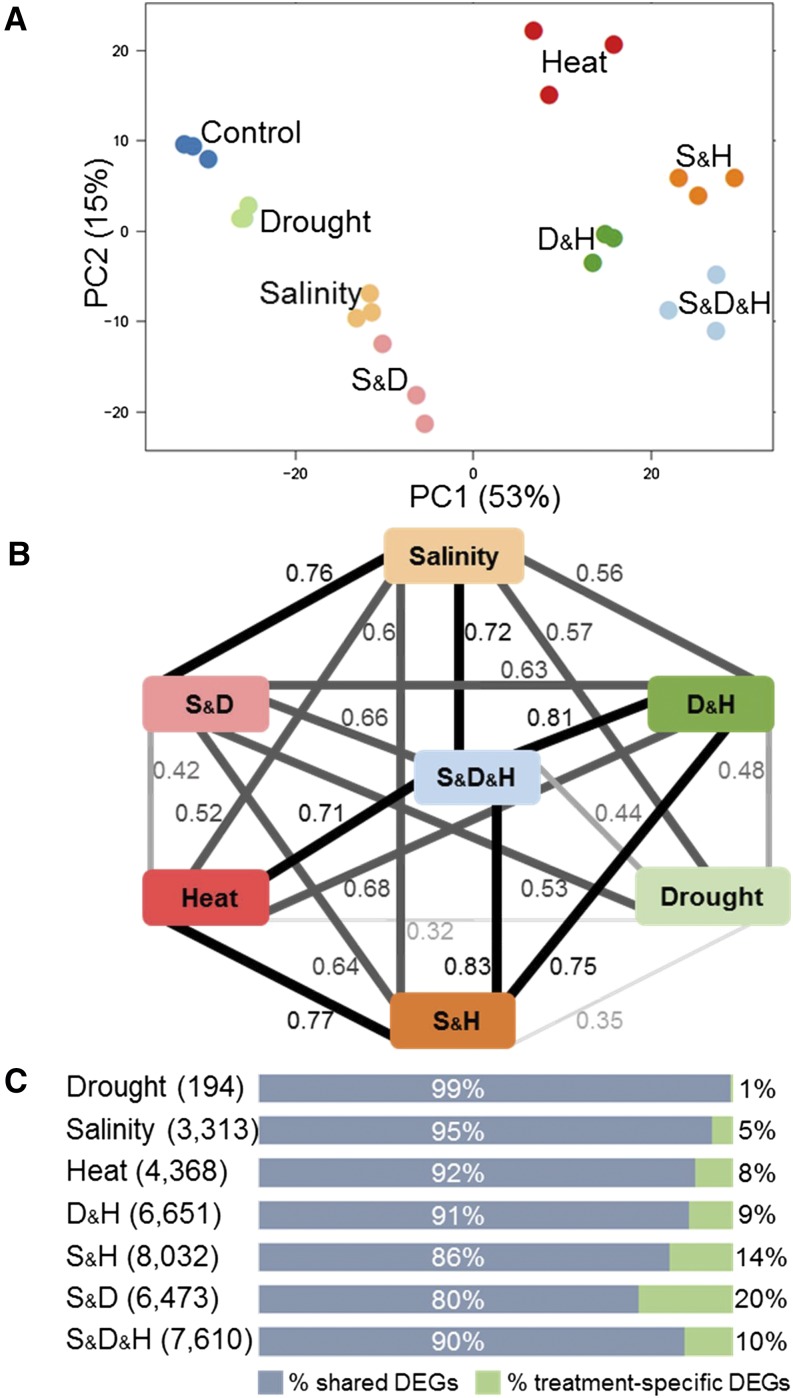
Figure 3.
Stress transcriptome profile. A, Principal component (PC) analysis of rlog transformed gene expression data, generated by RNA-sequencing. Each treatment contains three biological repeats and is indicated by a different color. B, A correlation map of fold change values across stress treatments. Correlation coefficient (r) between two samples is designated on each edge. Black edges indicate r ≥ 0.7 and gray edges indicate r < 0.7. C, Percentage of shared (blue) and treatment-specific (green) significantly differentially expressed genes (DEGs) within each stress treatment (FDR ≤ 0.05, FC ≥ |0.5|). Number of DEGs in each treatment is indicated in brackets. Drought and heat (D&H), salinity and heat (S&H), salinity and drought (S&D), and salinity, drought, and heat (S&D&H).

