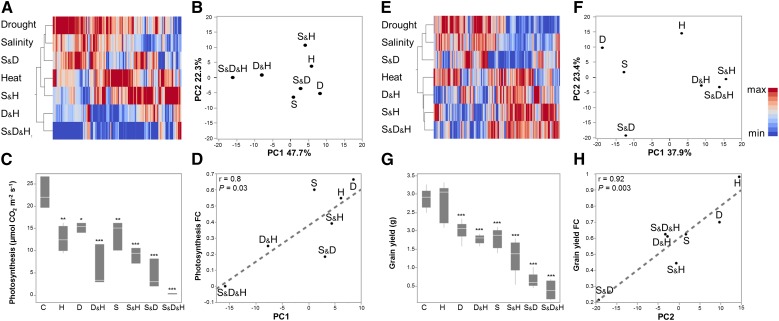
Figure 4.
Association between transcriptome and physiology. A to D, Correlation between expression pattern of photosynthesis associated genes and photosynthesis measurements. E to F, Correlation between expression pattern of stress associated genes and grain yield. Transcripts were assigned to each category based on MapMan bin allocation. A and E, hierarchical clustering heat-map of gene expression of each category. First (B) and second (F) principle components (PC) that were detected by principal component analysis of gene expression. Box plots of (C) photosynthesis and (G) grain yield under control and stress treatments. Values are means ± sd (n = 3 and 6 for photosynthesis and grain yield, respectively) Significant differences, detected by one-way ANOVA followed by Dunnet’s test, are denoted with asterisks (*P ≤ 0.05, **P ≤ 0.01 and ***P ≤ 0.001). Correlation between first (D) or second (H) PC for photosynthesis or stress associated genes, respectively, and fold change (FC) values of the corresponding trait. Red and blue colors indicate high and low values compared with the mean of each gene, respectively. Conditions are as follows: control (C), heat (H), drought (D), salinity (S), drought and heat (D&H), salinity and heat (S&H), salinity and drought (S&D), and salinity, drought and heat (S&D&H).

