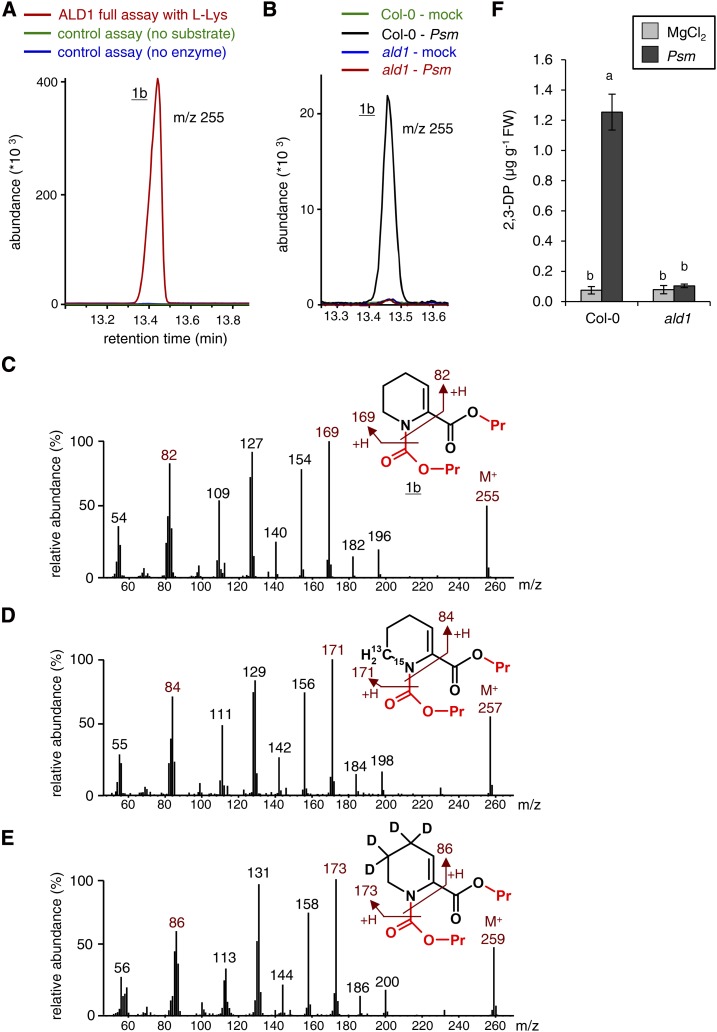
Figure 3.
ALD1-mediated l-Lys conversion: formation of 2,3-DP as determined by GC-MS analysis using propyl chloroformate derivatization (procedure B). A, Segment of overlaid ion chromatograms (m/z = 255) of GC-MS-analyzed l-Lys conversion assays with ALD1 protein showing the propyl chloroformate-derivatized transamination product 1b. Red, ALD1 enzyme assay with l-Lys as an amino acid substrate and pyruvate as an acceptor oxoacid; green, control assay lacking ALD1 protein; blue, control assay lacking l-Lys as a substrate. B, Segment of overlaid ion chromatograms (m/z = 255) from extract samples of mock- or Psm-inoculated Col-0 wild-type and ald1 mutant leaves. Leaf samples were harvested 48 hpi. Substance 1b accumulates in the Col-0-Psm samples only. C, Mass spectrum and molecular structure of substance 1b derived from ALD1-mediated l-Lys conversion assays. The mass spectral information is consistent with a 2,3-DP derivative that is propyl carbamylated at its amino group and propyl esterified at its carboxyl group. The groups introduced by propyl chloroformate derivatization are labeled in red. The molecular ion (M+) and plausible ion fragments are indicated. D, The use of l-Lys-6-13C,ε-15N as a substrate in ALD1 in vitro assays results in the formation of an isotope-labeled variant of 1b with shifts in the mass spectral fragmentation pattern by 2 mass units compared with unlabeled 1b. E, The use of l-Lys-4,4,5,5-d4 as a substrate in ALD1 assays results in the formation of an isotope-labeled variant of 1b with shifts in the fragmentation pattern by 4 mass units compared with unlabeled 1b. F, Quantification of 2,3-DP in leaf extracts from Col-0 and ald1 plants. Leaves were mock (MgCl2) infiltrated or Psm inoculated and harvested at 48 hpi. Bars represent means ± sd of three biological replicate samples, each consisting of six leaves. FW, Fresh weight. A correction factor for the absolute quantification of 2,3-DP was estimated as described in “Materials and Methods.” Different letters above the bars denote statistically significant differences (P < 0.001, ANOVA and posthoc Tukey’s honestly significant difference [HSD] test).

