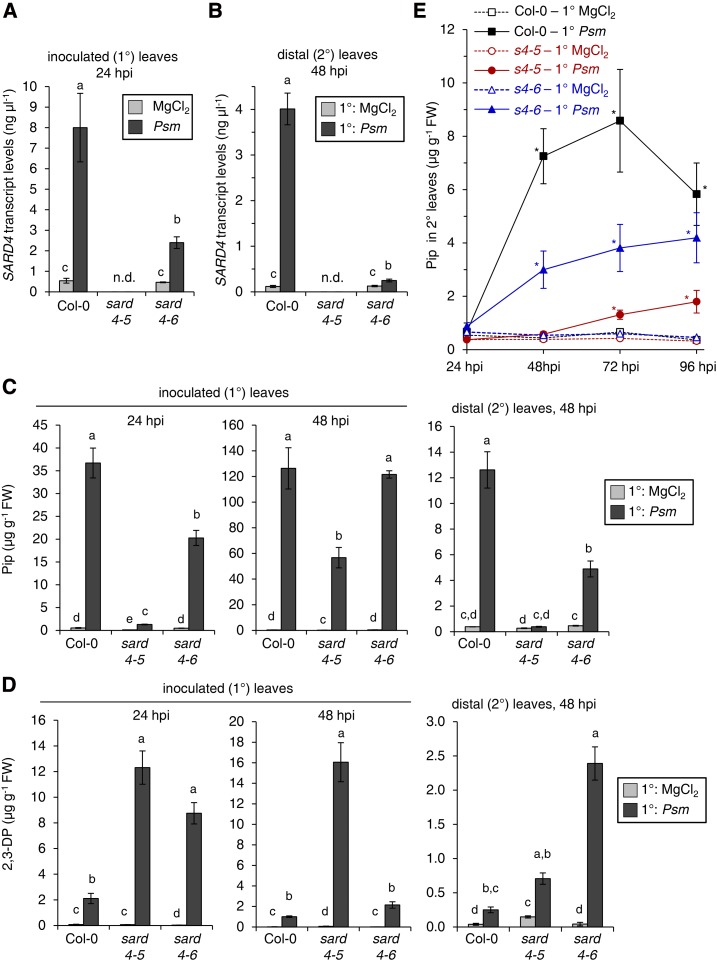
Figure 8.
Transcript levels of SARD4 and metabolite levels of 2,3-DP and Pip in inoculated (1°) and distal (2°) leaves of wild-type Col-0, sard4-5, and sard4-6 mutant plants in response to P. syringae and mock treatments. A, SARD4 transcript levels in 1° leaves of Col-0, sard4-5, and sard4-6 plants infiltrated with Psm (OD600 = 0.005) or with 10 mm MgCl2 (mock treatment) at 24 h after treatment. Transcript values are given in µg µL−1 and represent means ± sd of at least three biological replicate samples from different plants, each replicate consisting of six leaves. Values for biological replicates were calculated as means of two technical replicates. Different letters above the bars denote statistically significant differences (P < 0.002, ANOVA and posthoc Tukey’s HSD test); n.d., no transcripts detected. The results were confirmed in two independent experiments. B, SARD4 transcript levels in untreated distal (2°) leaves of Col-0, sard4-5, and sard4-6 plants infiltrated in 1° leaves with Psm (OD600 = 0.005) or 10 mm MgCl2 (mock treatment) at 48 h after treatment. Other experimental details were as described for A. Different letters above the bars denote statistically significant differences (P < 0.002, ANOVA and posthoc Tukey’s HSD test); n.d., no transcripts detected. The results were confirmed in two independent experiments. C, Levels of Pip in treated 1° leaves of Col-0, sard4-5, and sard4-6 plants infiltrated with Psm (OD600 = 0.005) or 10 mm MgCl2 (mock treatment) at 24 h (left graph) and 48 h (middle graph) after treatment and in untreated distal (2°) leaves at 48 h after treatment of 1° leaves (right graph). Data represent means ± sd of at least three biological replicates from different plants, each replicate consisting of six leaves from two plants. Different letters above the bars denote statistically significant differences (P < 0.05, ANOVA and posthoc Tukey’s HSD test). The results were confirmed in two independent experiments. FW, Fresh weight. D, Levels of 2,3-DP in inoculated (1°) and distal (2°) leaves of Col-0, sard4-5, and sard4-6 plants. Experimental details were as described for C. The results were confirmed in two independent experiments. E, Levels of Pip in untreated 2° leaves of Col-0, sard4-5 (s4-5), and sard4-6 (s4-6) plants infiltrated with Psm (OD600 = 0.005) or 10 mm MgCl2 at 24, 48, 72, and 96 h after treatment. Data represent means ± sd of three biological replicates. Asterisks denote statistically significant differences between Psm- and mock-treated samples of a given plant genotype and time point (P < 0.01, two-tailed Student’s t test).

