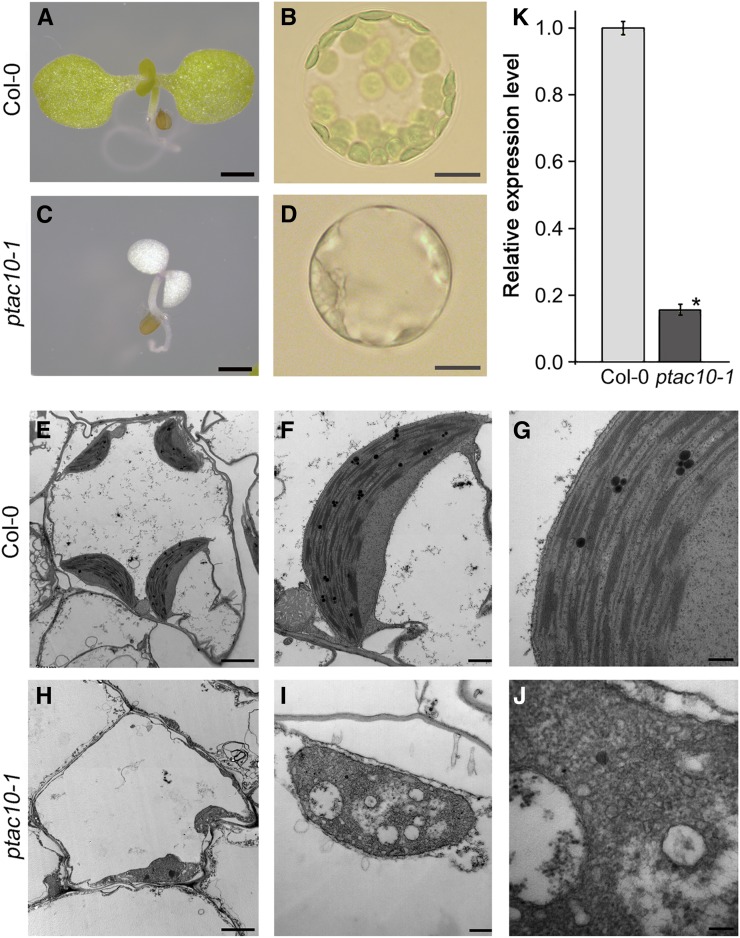
Figure 1.
Characterization of the ptac10-1 mutants. A to D, Images of 7-d-old Columbia-0 (Col-0) and ptac10-1 mutant seedlings (left) and the protoplasts isolated from these plants (right). Bars = 1 mm in the seedling images and 5 μm in the protoplast images. E to J, Chloroplast ultrastructure of 7-d-old Col-0 (E–G) and ptac10-1 mutants (H–J). Transmission electron microscopy images showed that the ptac10-1 mutants are defective in chloroplast development. Bars = 2 μm in the left images, 0.5 μm in the middle images, and 200 nm in the right images. K, Analysis of the expression levels of pTAC10 in the ptac10-1 mutant and Col-0 by quantitative reverse transcription (qRT)-PCR. Error bars indicate sd. The asterisk indicates a statistically significant difference between the corresponding samples and their control (P < 0.01, Student’s t test). All experiments were repeated at least three times with similar results.

