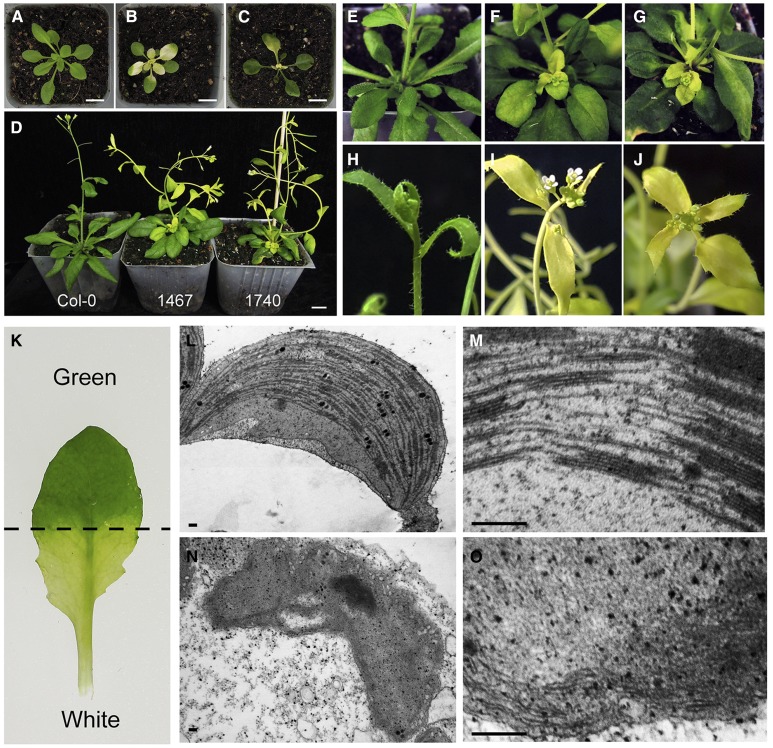
Figure 9.
Abnormal whitening phenotypes in pTAC10-1467- or pTAC10-1740-overexpressing plants. A to C, Four-week-old Col-0 (A), 35s::pTAC10-1467/Col-0 (B), and 35s::pTAC10-1740/Col-0 (C) with the abnormal whitening phenotype. D, Seven-week-old Col-0 (left), 35s::pTAC10-1467/Col-0 (middle), and 35s::pTAC10-1740/Col-0 (right) with the abnormal whitening phenotype. 1467 and 1740 indicate 35s::pTAC10-1467/Col-0 and 35s::pTAC10-1740/Col-0, respectively. E to J, High-resolution images of Col-0 (E and H), 35s::pTAC10-1467/Col-0 (F and I), and 35s::pTAC10-1740/Col-0 (G and J). K, Image of a 35s::pTAC10-1467/Col-0 leaf with the abnormal whitening phenotype. L and M, Ultrastructure of the plastid in the green part of K and its high-resolution image. N and O, Ultrastructure of the plastid in the whitening part of K and its high-resolution image. Transmission electron microscopy analysis was repeated twice with similar results. Bars = 1 cm (A–D) and 200 nm (L–O).

