Figure 2.
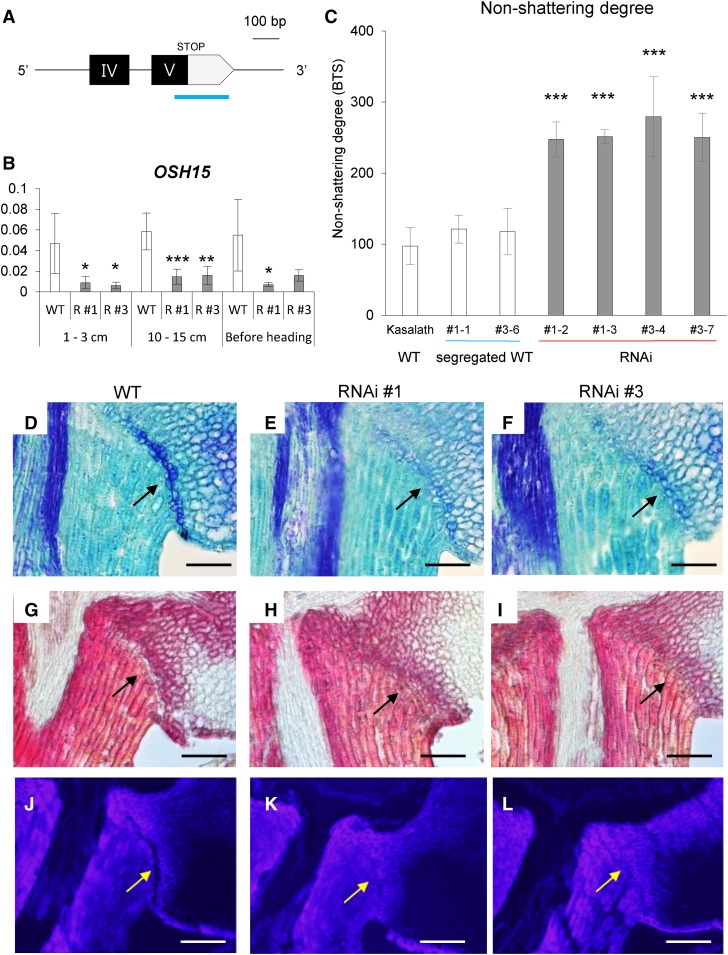
Analysis of OSH15 RNAi transgenic plants in cv Kasalath. A, Schematic diagram of the OSH15 RNAi region. The 265-bp 3′ UTR (blue line) fragment was used to generate the OSH15 RNAi construct. B, Expression levels of OSH15 in transgenic plants. Developing panicles were used (n = 4; *, P < 0.05; **, P < 0.01; and ***, P < 0.001). C, Degree of shattering in the cv Kasalath segregated wild type and OSH15 RNAi lines (n = 10 or more; ***, P < 0.001). D to I, Longitudinal sections across the AZ before harvest from the cv Kasalath wild type (WT; D and G) and RNAi lines 1 (E and H) and 3 (F and I). Sections were stained with Toluidine Blue (D–F) or phloroglucinol-HCl (G–I). Arrows indicate AZ. Bars = 100 µm. J to L, Longitudinal sections across the AZ after heading from the cv Kasalath wild type (J), RNAi line 1 (K), and RNAi 3 (L). Sections were observed under UV light. Arrows indicate AZ. Bars = 100 µm.

