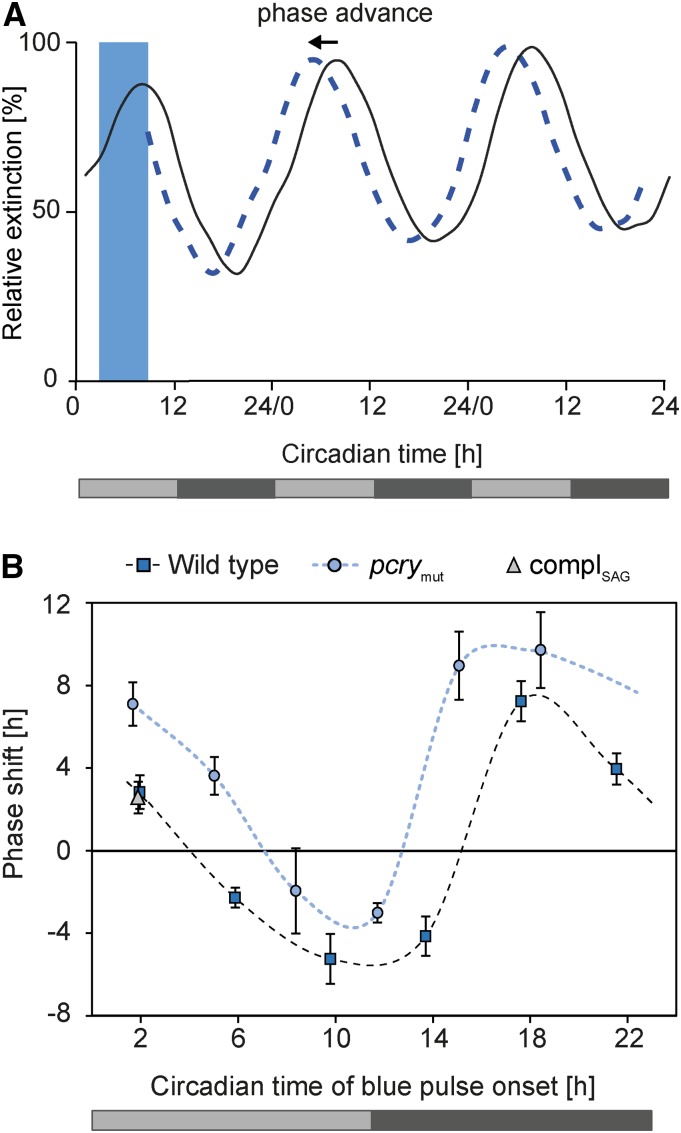
Figure 4.
Phase-response curves of photoaccumulation rhythms of Chlamydomonas wild type, pcrymut, and complSAG. A, Schematic photoaccumulation curve of wild-type cells after blue light illumination for 6 h (blue bar) starting at CT2 (dashed blue line) in comparison with cells kept in darkness (black line). The ordinate shows cell density documented as relative extinction in percentage, and the abscissa shows circadian time (see “Materials and Methods”). Light gray bars indicate subjective day, and dark gray bars indicate subjective night in constant darkness. B, Phase-response curves of photoaccumulation rhythms of the wild type (blue squares), pcrymut (blue circles), and the complemented mutant strain in the SAG73.72 background, named complSAG (gray triangles), after blue light pulses (see “Materials and Methods”; n ≥ 3). Blue light illumination was performed at CT2, CT5.9, CT9.8, CT13.7, CT17.6, and CT21.5 for the wild type and at CT1.7, CT5, CT8.4 CT11.7, CT15.1, and CT18.4 for the mutant. For complSAG, blue light illumination was done only at CT1.9. The ordinate shows phase shift in hours ± sd, and the abscissa shows circadian time in hours. The light gray bar shows the subjective day, and the dark gray bar shows the subjective night.

