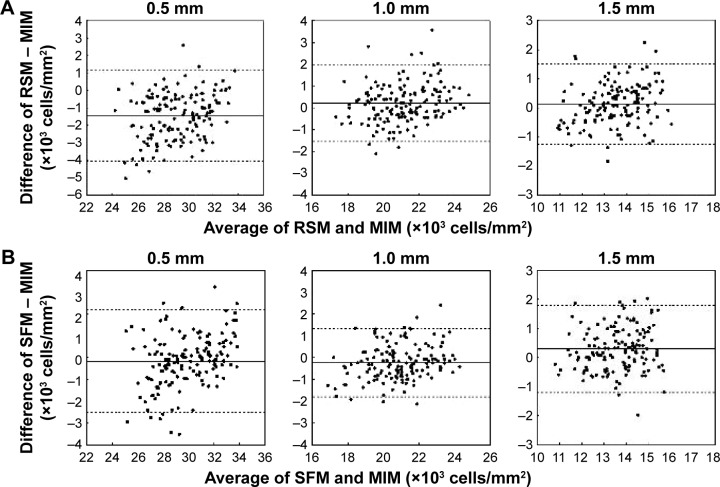
Figure 5.
Bland–Altman plots between two automated methods and the MIM.
Notes: (A) Bland–Altman plot between RSM and MIM. (B) Bland–Altman plot between SFM and MIM. X-axis denotes averages of cone photoreceptor densities of the two methods for individual trials. Y-axis denotes differences between the two methods on individual trials. Solid line denotes the average of differences in cone photoreceptor densities between two methods for all trials. Dotted lines denote ±1.96 times the SD of the differences.
Abbreviations: MIM, manual identification method; RSM, region-based segmentation method; SFM, spatial filtering method; SD, standard deviation.

