Figure 6.
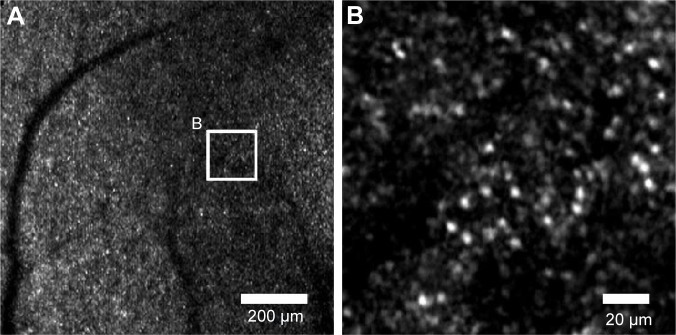
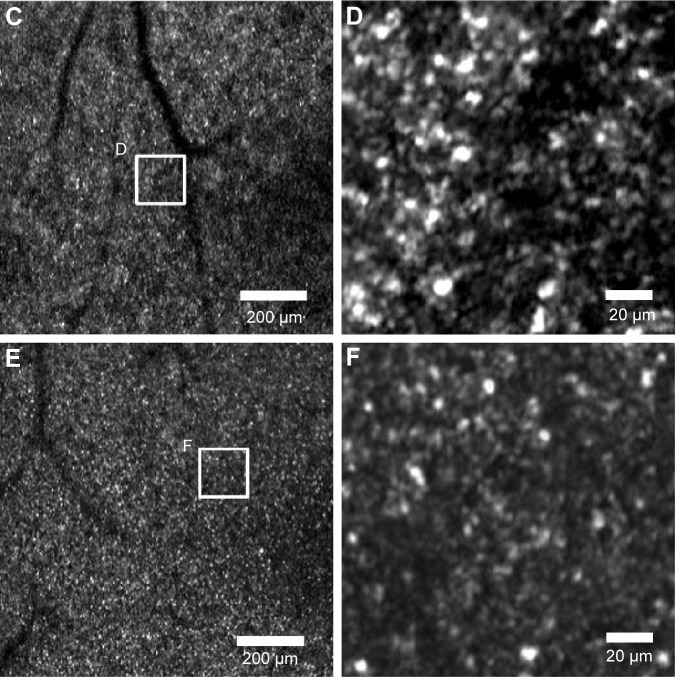
AOSLO images of an affected retinal area (high- and low-magnification AOSLO images of diseased eyes).
Notes: The center of all images corresponds to ~1 mm temporal from the fovea. The white square on the low-magnification images indicates the corresponding area of high-magnification images. (A) Right eye of subject 16. (B) High-magnification image of (A). (C) Right eye of subject 17. (D) High magnification image on (C). (E) Right eye of subject 18. (F) High-magnification image of (E). High-magnification images were averaged and cropped for the automated calculation method.
Abbreviation: AOSLO, adaptive optics scanning laser ophthalmoscope.


