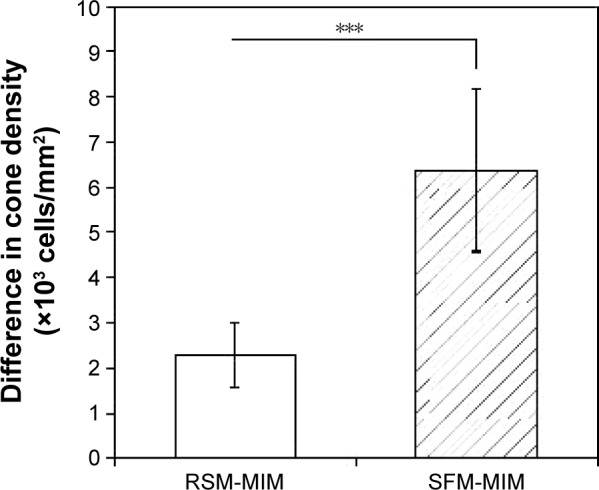
Figure 7.

Differences in estimated cone densities between automated methods and manual identification of diseased eyes.
Notes: A total of 15 diseased retinal areas (five image areas from three patients) were analyzed. RSM-MIM and SFM-MIM denote differences in estimated cone densities between RSM and MIM and between SFM and MIM, respectively. Error bars indicate SD. ***P<0.001 (Wilcoxon rank sum test).
Abbreviations: RSM, region-based segmentation method; MIM, manual identification method; SFM, spatial filtering method; SD, standard deviation.
