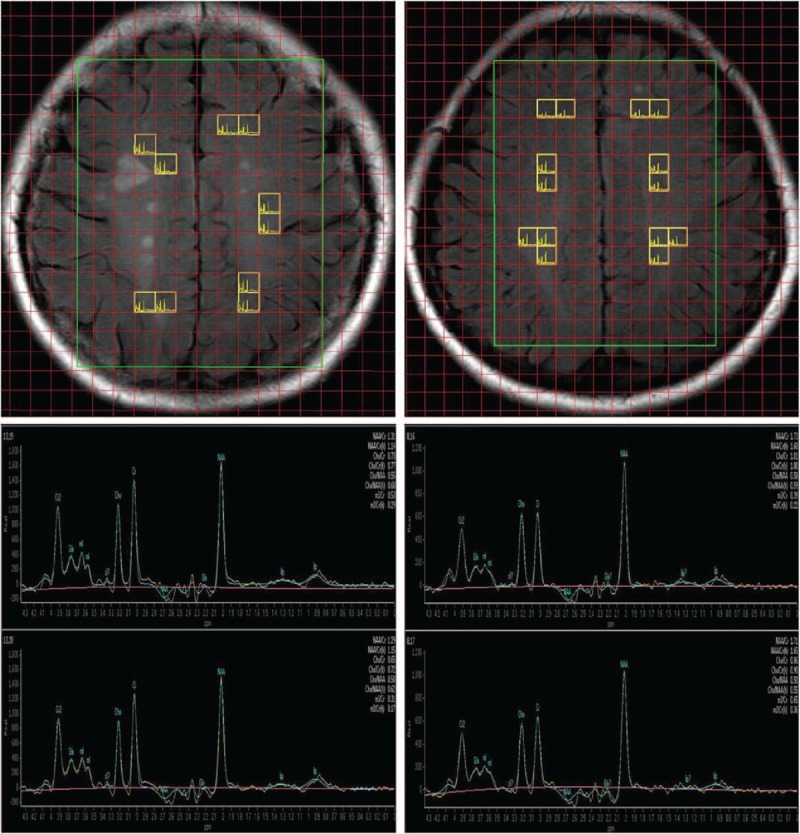
Figure 1.

The volume of interest superimposed on a fluid-attenuated inversion recovery image, including an MS patient (top left) and a control subject (top right). Representative spectra maps of an MS patient (lower left) and a healthy control (lower right). All spectra used for analysis were selected from voxels located in the NAWM. MS = multiple sclerosis, NAWM = normal appearing white matter.
