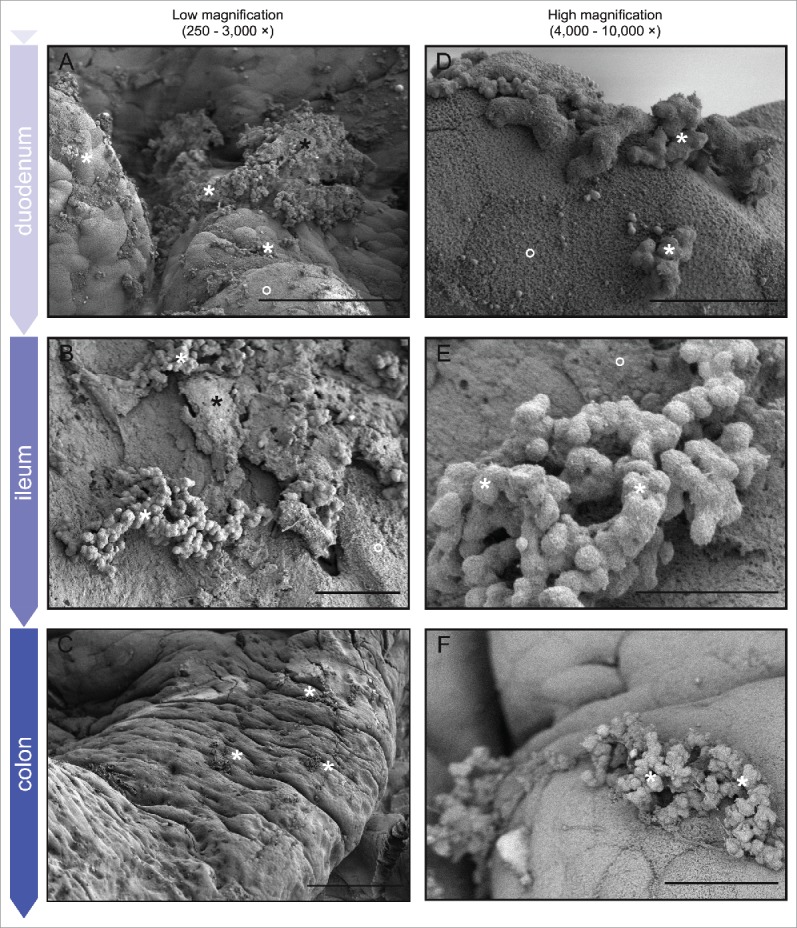
Figure 4.

LV-SEM of representative murine GI tract tissue sacrificed 7 d post-gavage with E. faecalis. Rows show samples from each of the major divisions of the lower GI tract from the proximal duodenum through the distal colon; columns show increasing micrograph magnification (left to right). For space reasons low magnification micrographs demonstrating anatomic structure and micrographs of surface colonization in the jejunum and cecum are presented separately in Fig S1. White stars = E. faecalis microcolonies; black stars = retained fecal material; open circles = mucinous material (host).57 Left column: The traditional biofilm ECM structure of E. faecalis microcolonies can be seen throughout the lower GI tract. Note the relatively large distances between many microcolonies even 7 d post-inoculation (mostly clearly in C).Right column: Biofilm microcolonies exhibit wide size variation, from a few tens of cells (D) to several hundred or more (E). Note also the generally bland nature of the underlying host epithelium (D, F)Bars: A = 50 µm; B, C, F = 10 µm, D = 1 mm, E = 200 µm.
