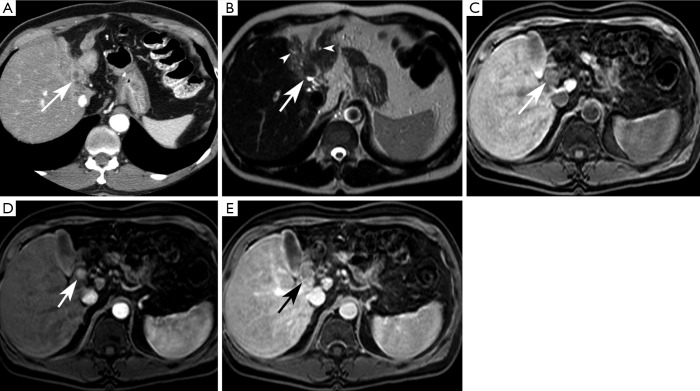
Figure 4.
Intraductal-growth cholangiocarcinoma in a 67-year-old male. (A) Transverse post-iodinated contrast CT image in the portal venous phase shows a rim enhancing soft tissue mass (arrow) with marked atrophy of the left hepatic lobe; (B) T2-weighted image shows an intraductal mass (arrow) causing mild biliary ductal dilatation (arrowheads); (C) transverse fat saturated T1-weighted MR image without gadolinium chelate shows a hypointense mass (arrow). On fat saturated post-gadolinium chelate T1-weighted image (D), the mass is hypervascular (arrow) in the arterial phase, becoming slightly hypointense to liver parenchyma in the portal venous phase (E).

