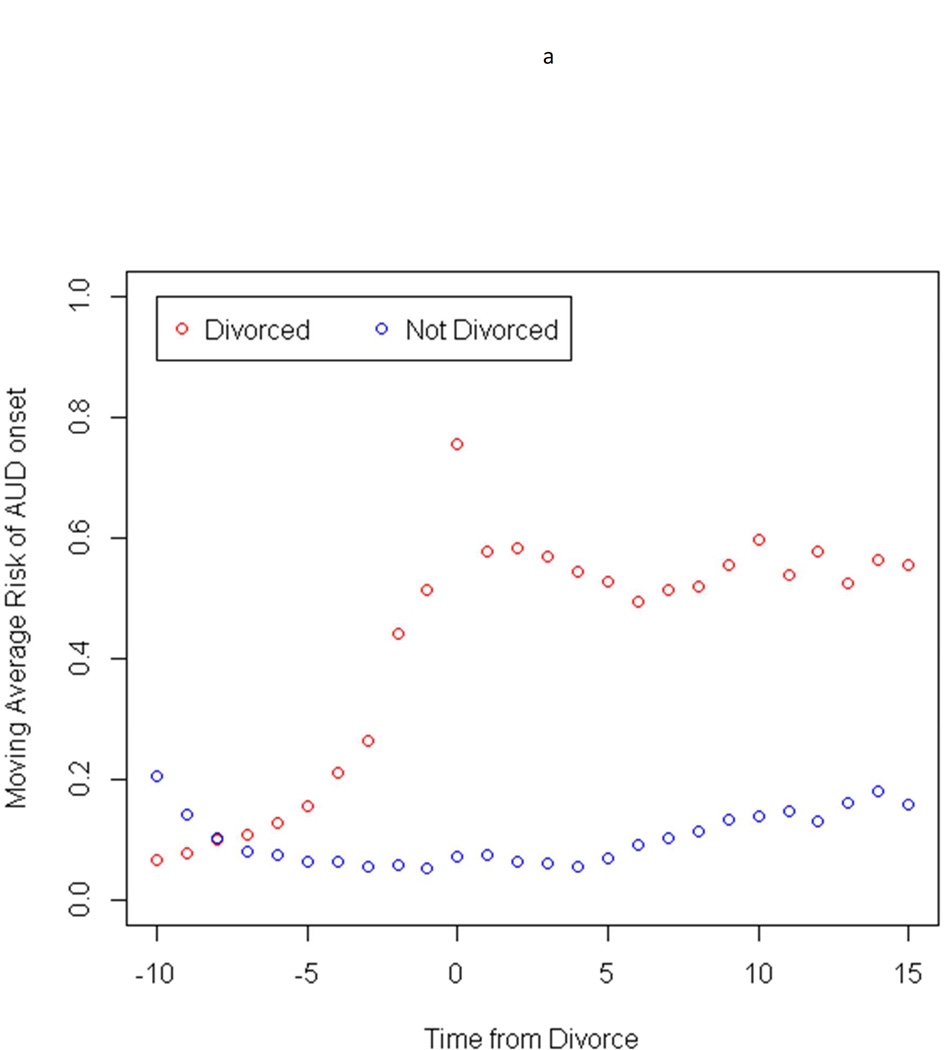
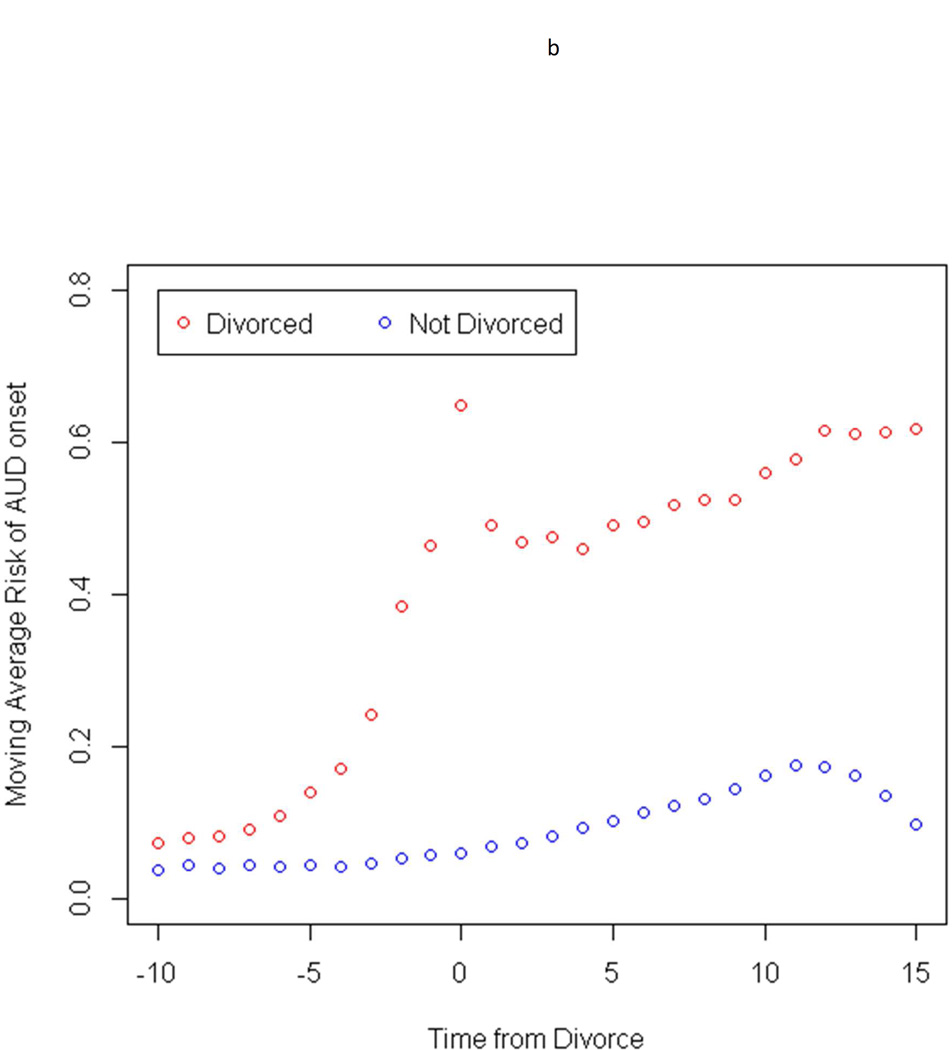
Figure 1.
a – The temporal relationship between divorce and the moving yearly prevalence of first onset of AUD in males (red dots) who were married between the ages of 18 and 25. For each pair, the time of divorce was given the value of zero. The figure also shows (blue dots) the rate of AUD onsets in stably married males whose average age at the zero point matches the age of the divorced sample. All date points, except at age zero, represent a three year rolling average. Therefore, the plotted risk at one time point is the weighted average of the observation at that time point plus the one before and one after. The exception is the estimate at time 1 or −1 which is the weighted average only of time 1 (or −1) and 2 (or−2) and does not include the value at time 0.
b – The temporal relationship between divorce and the yearly prevalence of first onset of AUD in males (red dots) who were married between the ages of 26 and 35. See legend to figure 1a for further methodological details.


